In order to pile up profits in the Forex market, you should choose a strategy that is backed by statistics. Choosing the wrong strategy with a poor risk to reward ratio can lead to huge losses, and you don’t want that happening. Here we shall look into a solid Forex strategy that incorporates the Average directional movement index (ADX) and Relative Strength Index (RSI).
What is the ADX + RSI strategy?
In spite of the similarities shared by this strategy with the ADX + MACD scheme, there is a major difference between the two. You can use the Relative Strength Index to measure the price momentum, something that is not possible with MACD. Combining the RSI and ADX indicators allows us to clearly visualize the price trends in the Forex market for the short term.
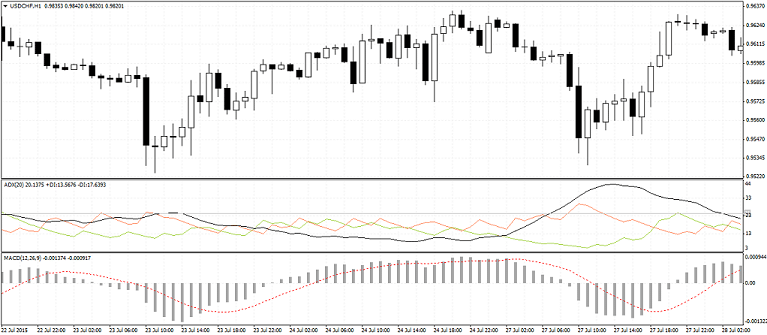
If you plot the indicators on the chart, it looks something like this:

Forex players get a whole bunch of important information from this scheme. It allows them to utilize the trend strength and pile up their profits. Here a change in the trend is indicated by the divergence between the Relative Strength indicator and the price of the pair.
It is an uptrending market when the price falls, and the RSI rises, whereas a downtrending market is indicated by the price rising and the RSI falling.
Trading rules
Using the ADX indicator with positive and negative directional indicator values, you can assess how strong a trend is. Firstly, if the ADX value is less than 25, it is a sideways market, and there is no trend. Only when the ADX is more than 25, we can say that the market is either uptrending or downtrending.
While using this strategy, you must remember the following rules:
- Buy rule: For a viable buy position, the positive directional (DI+) index must intersect the negative directional index (DI-) and move upwards. Additionally, the Relative Strength Index with 7 periods should close at a value of more than 70. In that case, you should place a long trade at the closing point of the candle while placing the stops near the base, exiting when the value of the RSI falls beneath 70 again.
- Sell Rule: A good occasion for a short trade can be identified when the negative directional index (DI-) intersects the positive directional index (DI+) and moves upward. The value of the RSI must be less than 30, which shows an oversold Forex market all set for a reversal. This is your cue to sell at the candlestick’s closing point while placing stops near the peak and exit the moment the value of the indicator is more than 30 again.
Settings
The indicator settings for this scheme are pretty simple. The period for the ADX indicator must be 20. Normally, the period for the Relative Strength Index is taken as 14, although for our purposes we have taken it to be 7.
When the RSI is less than 30, it is a sign of an oversold Forex market, and when it is more than 70, it is a sign of an overbought market.
Trading strategy example
Let us now try to understand the strategy with the help of an example. We shall look at buy and sell setups individually.
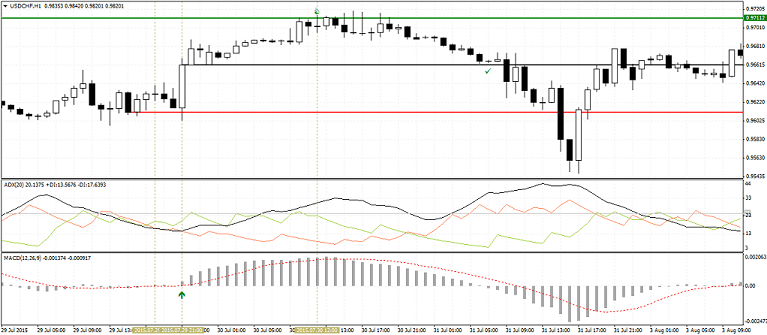
Buy Strategy

The above chart shows a buy set up. When the positive directional index crosses the negative directional index and moves upwards, it is a signal of a buy scenario. After a couple of candles, the value of the 7-period Relative Strength Index goes above 70.
At the closing point of this candle, a buy trade is placed while the stop losses are situated at the trough. While the RSI value remains above 70, the trader holds the buy position till the point where the RSI value goes below 70 once more. In that instance, the trader exits the trade.
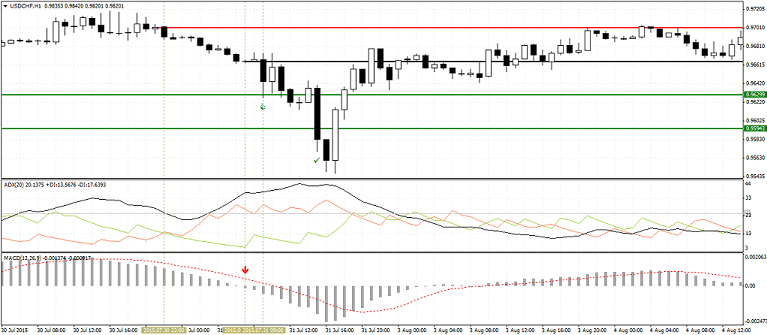
Sell Strategy

Once the negative directional index intersects the positive directional index and advances upwards, the Forex trader gets the indication of probable sell occasion. After a certain point, the Relative Strength Index moves beneath 30, and the trader placed a sell trade at the candle’s closing point while keeping stop losses at the peak.
The intense momentum carries the prices even lower, thus generating profit from the sell position. Once the RSI value exceeds 30, the position is exited.
Pullback strategy
The Relative Strength Index can be used to identify points where a small pullback has taken place. This can cause trend-friendly price shifts, so a Forex trader may purchase pullbacks during a bullish trend and sell rallies during a bearish one.
Let’s consider an example where the buy threshold is 45, and the sell threshold is 55. At the point the RSI shifts beneath 45, the trader places a long trade. In the same manner, when the Relative Strength Index exceeds 55, the trader places a trade beneath the trough of the earliest downtrending candle.
RSI and ADX scalping
This strategy can be used to find the Forex market’s momentum strength. Let’s consider a trade of 1-minute duration involving major pairs with the spreads being lower than one pip. When the ADX value is more than 25, and the RSI intersects the 60-line, moving upwards, you can place a long trade.
The sell position is activated when the Relative Strength Index sinks beneath 35, and the Average Directional Index is more than 25. The first few stop losses should be placed a few pips beneath the entry bar. This scheme can be automated effortlessly on a trading platform.
Summing up
Now you have an idea about the RSI and ADX Forex strategy. You can use it for identifying trading signals. But, at the same time, you should remember to follow the directives of operating inside a trend. Prior to initiating a trade, you should ensure its presence on the chart.


