The trend is your friend’ is an old and popular expression in the financial markets. Consistently identifying the trend is arguably the single most crucial element when conducting technical analysis in forex. Without one, profiting is nearly impossible.
Following or trading with the trend is a bread-and-butter way to approach any instrument where counter-trend is frowned upon or reserved for more seasoned and daring investors.
Aside from using price action, there are a plethora of indicators built specifically for identifying trends and trading with them.
Most of these indicators have their roots firmly in stock trading popularized several decades ago. This article will cover the basic definition of the trend, where traders need to be careful, and a brief overview of some of the most commonly used indicators in this regard.
Defining the trend
Defining the trend is not as simple as stating its technical definition, which is the general direction that prices in a market are moving over a particular period. This interpretation does lay the foundation, though determining the actual trend is becoming far more intricate, mainly because of the different time frames that exist.
Also, an instrument never moves in a straight line, nor does it often trend for a long time, leading some to seriously believe that markets only trend 30% of the time and range for the rest.
Nonetheless, we characterize an uptrend when a market makes successive higher highs and higher lows over a specified period.
We define a downtrend when a market makes successive lower lows and lower highs over a specified period.
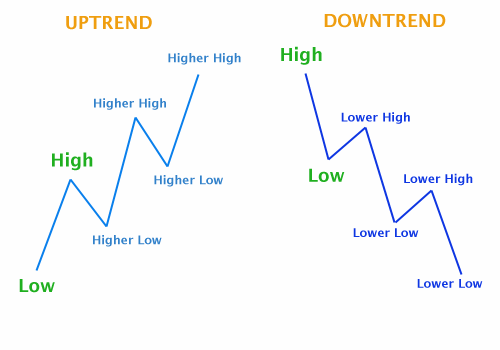
We describe the high as the highest point price has reached before retracing, while a low as the lowest point price reached before retracing.
When the trend ‘bends’
As with all indicators, trend tools lag heavily because their formulas consider past prices. In truth, no one truly always knows whether a market is trending or not until after the fact.
Also, depending on the trader and their point of reference, what may look like an uptrend to one may be a downtrend to another. Below we see the same instrument represented in two different time-frames, which clearly show two distinct trends.
Therefore, trend indicators are prone to whipsaws or getting traders too late for an entry. As the great Ed Seykota once said, ‘The trend is your friend until the end where it bends.’
It’s more than just the trend indicator
When selecting a trend indicator, traders have to keep in mind not to find themselves in situations where they identify a trend too late right before it reverses. Aside from the chosen indicator, understanding the type of trader one is, and their reference time-frame is equally, if not more important, to minimize false signals and ensure reliable trade ideas.
For example, swing and position size traders typically view long-term time-frames (from the H4 and above) and use settings considering a high number of days for past data to achieve ‘smoother’ or less ‘noisy’ results.
The same holds true for day traders and scalpers who will naturally favor fast-paced, smaller time-frames like the 15 minute and below. They may edit their indicators’ settings to reflect the quick changes in prices and fully accept how ‘noisy’ this becomes.
Most popular trend indicators
There are several multi-purpose indicators that do more than just identify the trend. The list below provides a good balance of these.
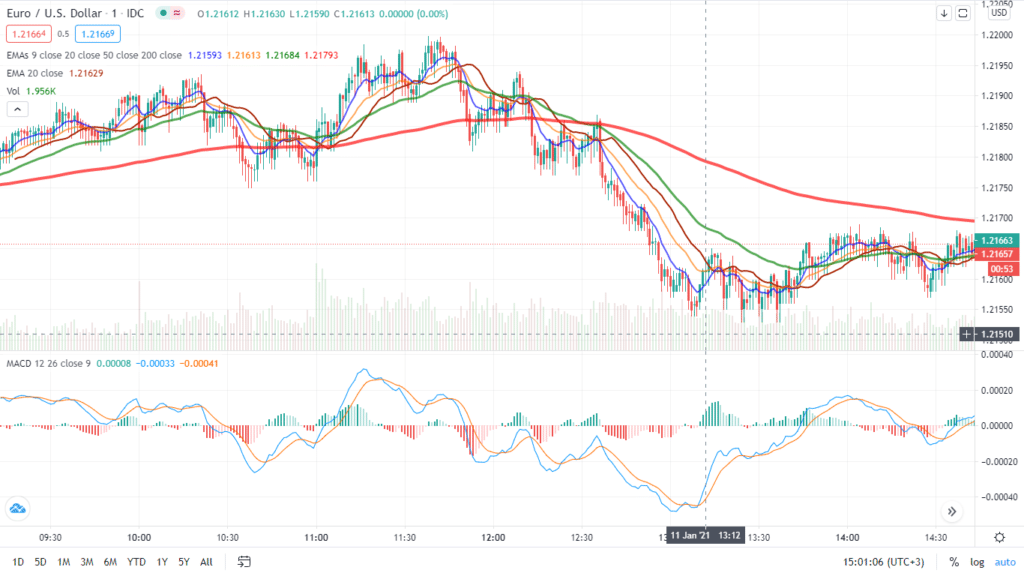
Moving averages (MA)
No article about the trend would be complete without mentioning moving averages. The concept of the moving average forms the basis of trend trading and countless other indicators.
A moving average is a dynamic (or ‘moving’) line on the charts calculating the ‘average’ of price data set over a defined number of days. The most common type of moving average is simple (see the picture below) and exponential, the latter of which emphasizes more on recent price data.
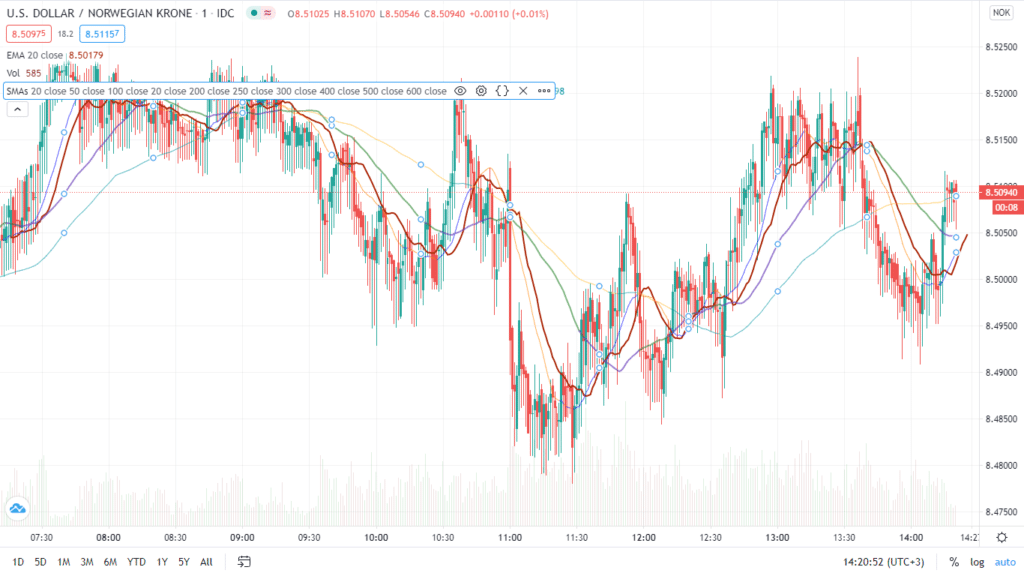
For example, the 50 EMA (exponential moving average) plots a line reflecting the average price (whether the open, close, low high, etc.) over the past 50 days. Traders can apply as many moving averages as desired, though the most common method uses two typically to exploit the classic crossover method.
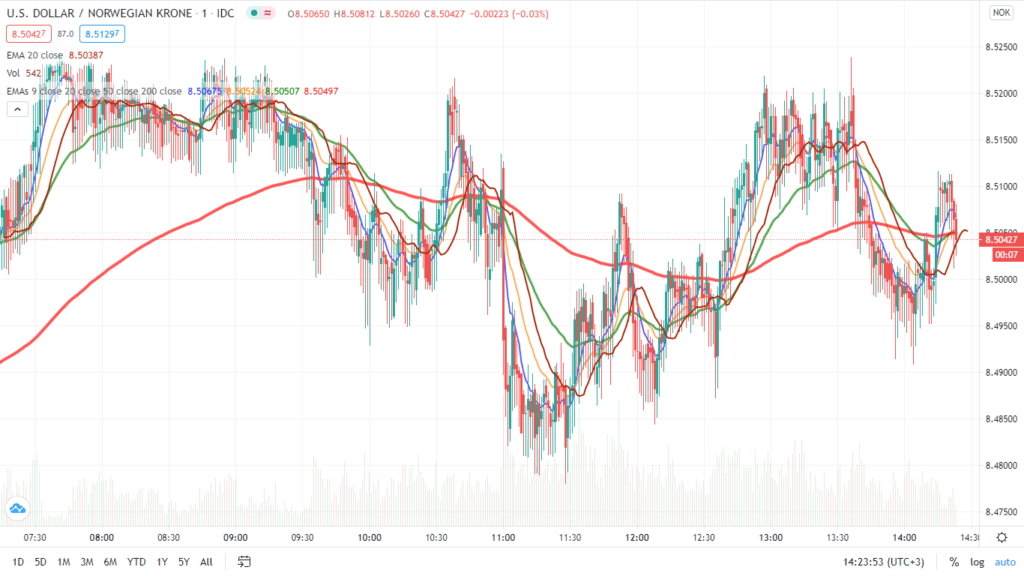
By applying several moving averages set for different time frames (20, 50, and 200 days in the example above), traders wait for these to ‘cross over’ before entering a position. Generally, though, the MA is used mostly to define the trend.
When the price is above the MA, this is considered an uptrend; when the MA’s price is below the MA, this is considered a downtrend.
Moving average convergence divergence (MACD)
A further expansion of moving averages is the MACD indicator, which is a lot more dynamic than its namesake. The MACD is quite multi-faceted as traders use it for entry signals into trends, momentum, and divergence.
This indicator consists of two MAs known as the MACD line and the signal line. The MACD line is the subtraction of two EMAs (exponential moving averages), one fast and one slow (default settings are 26 and 12, although traders can adjust this).
The signal line, which is typically a 9-day EMA, lies on a histogram along with the MACD line. Traders look for buy or sell opportunities when the signal line goes above or below the MACD line, respectively.
They gauge momentum strength using the histogram bars where readings above zero are taken as bullish, while those below zero are taken as bearish.
Bollinger Bands
Aptly named after its inventor, John Bollinger, Bollinger Bands reflect two standard deviations moving away from a simple moving average (typically a 20-day, like in the picture below, but it can be modified).
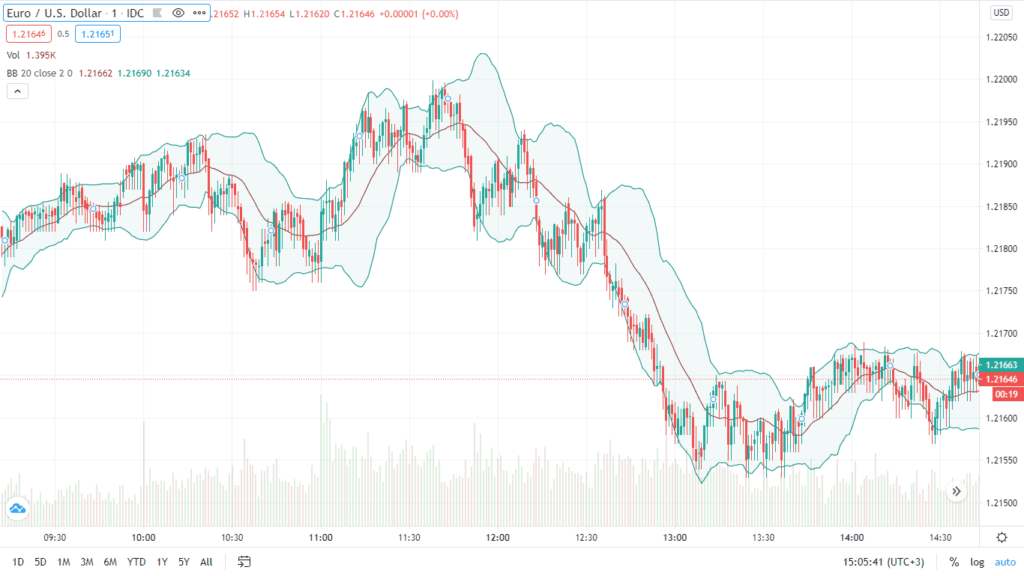
Overall, this indicator consists of three bands, the upper, middle (which is the adjustable simple moving average), and lower. Bollinger Bands primarily help analysts follow trends, identify overbought/oversold conditions, breakouts, and even range-bound markets.
Common tricks with this tool include:
- the squeezing of bands suggests a range (expansion signals trend resumption);
- when the price is above/below the middle band, traders consider a buy/sell signal respectively;
- when price moves outside of the upper/lower bands, this may indicate an overbought/oversold market, respectively.
Conclusion
Although there are several indicators to aid us, outlining a trend is a difficult job since the forex markets are dynamic. Regardless, one of the elements of trend identification is the time-frame because every single one can tell a different story.
Traders should always use other confirmations in approaching any trade idea rather than relying on standalone tools (not forgetting solid risk management should things go south).

