We have already discussed Reversal Patterns – Double Top and Double Bottom and learned to identify them and their effect. The double top and double bottom chart patterns are very useful in case of trading in financial markets. These patterns are found frequently, and these are very profitable chart patterns to trade.
One thing we should remember that, it is not necessary to form exactly similar high or similar low in case of a double top and double bottom pattern respectively. Sometimes double top patterns found with a lower high point and double bottom pattern with a higher low point.
These are also double top and double bottom patterns and are very profitable chart patterns. If you get a higher high then it is not the double top pattern. Inversely, if you get a lower low then it is not a double bottom pattern. A double top pattern would consist two high points, one similar or lower than the previous one. A double bottom consists two low points one similar or higher than the previous one. Now, here is the trading strategy to trade double top and double bottom chart patterns.
Time Frame: 4 hours, 1 hour or daily chart.
Suitable Pairs: All major pairs.
Indicators Used: Japanese candlesticks and Parabolic SAR.
Entry Conditions:
For long positions,
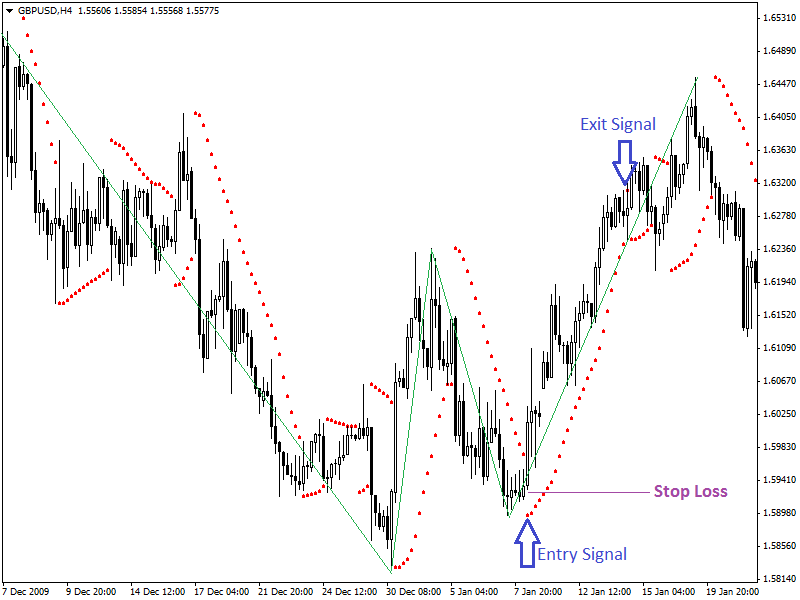
- Identify the Double Bottom chart pattern first.
- A dot of parabolic SAR below the candlestick.
For short positions,
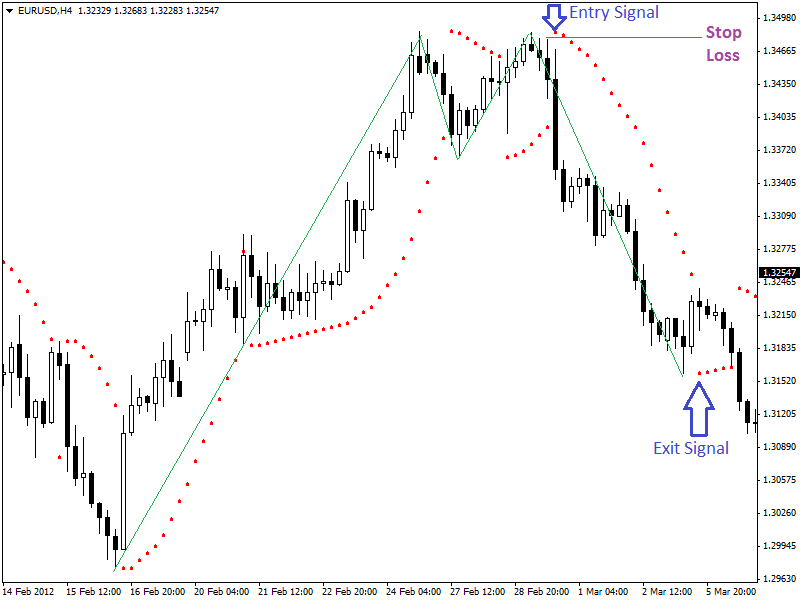
- Identify the Double Top chart pattern first.
- A dot of parabolic SAR above a candlestick.
Stop Loss:
- For long positions, 3 pips below the low point of the candlestick which has generated the entry signal.
- For short positions, 3 pips above the high point of the candlestick which has generated the entry signal.
Exit Conditions:
- For the long position, exit when a dot of parabolic SAR appears above the candlesticks.
- For short positions, exit when a dot of parabolic SAR appears below the candlestick.
Examples: Here is an example of this strategy for long positions in the 4-hour chart of GBP/USD (given below). 
Summary:
Trading double bottom and double top patterns are a very profitable strategy in case of the midterm and long term trading style. Using fundamental analysis can boost up the performance of this trading strategy.
A trader must have strict money management and discipline to be successful with this strategy.


