ForexEzy
No Result
View All Result
  • Home
  • Getting Started with Forex
  • Forex Education
    • Forex Basics
    • Forex Trading Strategies
    • Money Management
    • Risk Management
    • Technical Analysis
    • Fundamental Analysis
    • Trading Psychology
    • Social Trading
    • Automated Trading
  • Forex Tools
    • Forex Robots
    • Forex Indicators
    • Forex Signals
  • Top Forex Brokers
  • Top Forex Robots
  • Commentary
  • Blog
No Result
View All Result
ForexEzy
No Result
View All Result
Home Forex Education Forex Trading Strategies

Fibonacci Retracement Day Trading Strategy

by Tim Baudin
September 8, 2016
in Forex Trading Strategies
0
Fibonacci Retracement Day Trading Strategy
0
SHARES
11
VIEWS
Share on FacebookShare on Twitter

Fibonacci retracement is very useful in forex trading as it can determine potential support and resistance levels. These supports and resistances are particularly useful to detect reversals and entry opportunities. Fibonacci retracements tool is very useful for both day trading and long term trading with daily charts.

One should use Fibonacci retracements to find trading opportunities near retracement levels and then take entry decisions using technical indicators. We will discuss a day trading strategy using Fibonacci retracement tool. William % R is used in this strategy.

A trading strategy should have both entry and exit signals. Entry conditions are different for a long position and short position. Here, we will discuss on entry signals both for a long position and a short position.

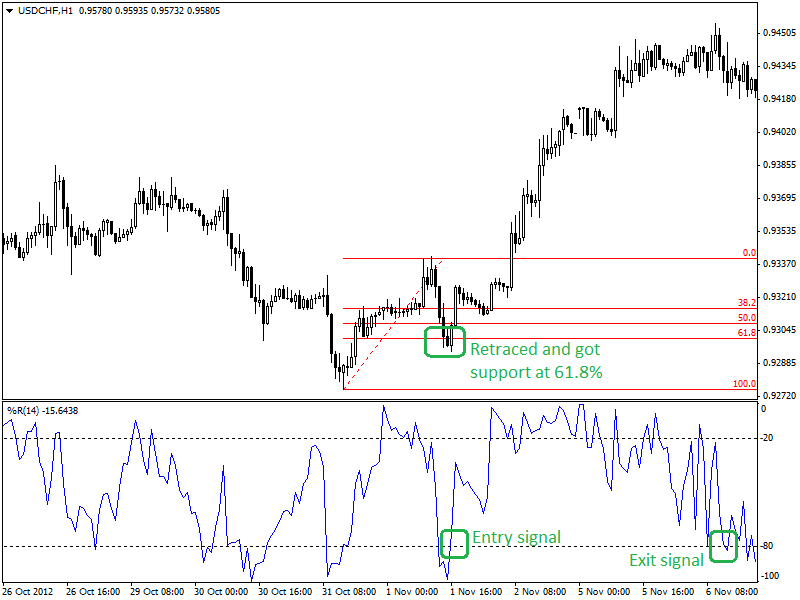
In the 1 hour chart of USD/CHF (given below), entry and exit signal for the long position has given. After a bullish movement, this pair has retraced up to 61.8% retracement level. This 61.8% level is a very important and strong support level. 61.8 is known as the “golden ratio” of Fibonacci. When the pair is at this retracement level after a bullish movement, we should look for an entry signal for the long position.

This entry signal can be detected by using an indicator. Indicators are very useful to generate buy and sell signals. In this strategy, Williams’ % R has taken to detect buy and sell signals. Williams’ % R is a leading indicator containing overbought (above -20) and oversold level (below -80). It is a buy signal when Williams’ % R crosses above -80 line. The entry signal is when a price is at Fibonacci retracement level (38.1%, 50%, 61.8%), and Williams’ % R generates a buy signal. Exit signal when Williams’ % R moved below the -80 line (oversold region). Here is the 1-hour chart of USD/CHF.

Fibonacci Retracement

Entry and exit rules for the long position are given below.

Entry (for long position):

  • The currency pair is at Fibonacci retracement level (38.2%, 50% or 61.8%) after a bullish movement.
  • Williams’ % R crosses above -80 line from oversold region.

Exit (for long position):

  • Williams’ % R moves into the oversold region after an entry signal has taken. 

Stop Loss:

  • A fixed stop can be placed at 40 pips below the entry price.
  • Or, when pair moves back into the oversold region.

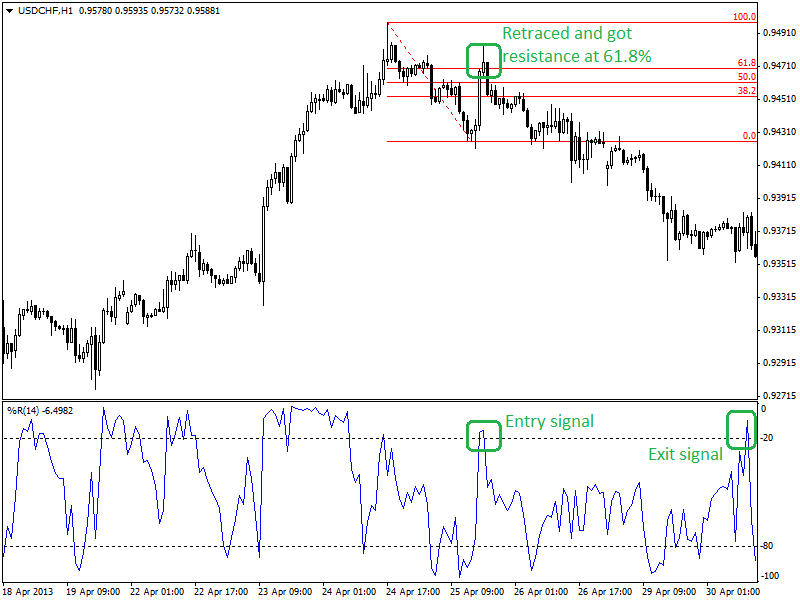
Entry and exit strategy in case of a short position is totally opposite to the long position. In the 1 hour chart of USD/CHF (given below), entry and exit strategy for a short position has described in details. This pair retraced to 61.8% level after a bearish trend. Here, 61.8% retracement level is working as a resistance for this pair, and thus, the pair has bounced back into its previous bearish trend. Williams’ % R has generated a sell signal when the pair has retraced to 61.8%. This sell signal has been generated when Williams’ % R has crossed below -20 line from the overbought region.

Fibonacci Retracement Day Trading Strategy

Entry and exit conditions are described below.

Entry (for short position):

  • Price retraced to Fibonacci retracement level (38.2%, 50% or 61.8%) after a bearish trend.
  • Williams’ % R crosses below -20 line from an overbought region.

Exit (for short position):

  • Williams’ % R moves above -20 line after an entry.

Stop Loss:

  • A fixed stop loss can be taken 40 pips above the entry price.
  • Or, when Williams’ % R moves back in the overbought region after entry when in a loss.

Summary: Fibonacci retracement tool can be used in different ways in different trading strategies. Trend lines and other indicators such as RSI or stochastic indicator can be used with Fibonacci retracements. Fibonacci retracements tool is highly effective for trading pullbacks as most of the cases pullbacks occur near these retracement levels.

ShareTweet
Previous Post

How to Trade with the Trend

Next Post

Effective and Simple Day Trading Strategy for Forex and Futures Markets

Related Posts

ADX+RSI: The Unbeatable Forex Trading Strategy

ADX+RSI: The Unbeatable Forex Trading Strategy

by Chintan Patel
January 18, 2021
0

In order to pile up profits in the Forex market, you should choose a strategy that is backed by statistics....

An Introduction To Forex Trend Indicators

An Introduction To Forex Trend Indicators

by Adam Stanley
January 13, 2021
0

The trend is your friend’ is an old and popular expression in the financial markets. Consistently identifying the trend is...

Using Band Trading Strategy for Profits

Using Band Trading Strategy for Profits

by Adam Stanley
November 5, 2020
0

What is band trading? Do markets trend about 15 % of the time only?  So, what to do during the...

4 Forex Strategies Based on Trading Style

4 Forex Strategies Based on Trading Style

by Richard Brase
October 7, 2020
0

The foreign exchange market is the largest financial market in the world, where many have amassed fortunes just by playing...

5 Moving Averages Trading Strategies to Profit from the Markets

5 Moving Averages Trading Strategies to Profit from the Markets

by Adam Stanley
June 11, 2020
0

The name “Moving Averages” is self-explanatory and refers to the average ”moving” with each price period. Among the multiple moving...

Load More

Best Forex EA

  • ROFX 9/10
  • Forex Fury 8/10
  • FXgoodway 7.5/10
  • Z Trader FX EA 7/10
  • Forex Incontrol Reborn 6.5/10

Popular News

  • The Best RSI and CCI Combination Trading Strategy for Optimum Returns

    The Best RSI and CCI Combination Trading Strategy for Optimum Returns

    2 shares
    Share 2 Tweet 0
  • Rofx Review – High Profitability and Stable Performance Analysis

    29 shares
    Share 29 Tweet 0
  • The Best Forex Scalping Strategy – Using 3 Popular Technical Indicators

    0 shares
    Share 0 Tweet 0
  • The Best MT4 Indicators & Expert Advisors For Forex Trading

    2 shares
    Share 2 Tweet 0
  • How to check if the indicator is repainting?

    2 shares
    Share 2 Tweet 0

Trading

Footer

We are dedicated to demystify the world of forex trading for you – no matter what level you are on.

Categories
  • Automated Trading
  • Day Trading
  • Forex Basics
  • Forex Brokers
  • Forex Education
  • Forex Forecasts
  • Forex Indicators
  • Forex Market Commentary
  • Forex Robots
  • Forex Signals
  • Forex Tools
  • Forex Trading Strategies
  • Fundamental Analysis
  • Money Management
  • News
  • Risk Management
  • Social Trading
  • Technical Analysis
  • Top World Traders
  • Trading Psychology
  • Uncategorized
Tags
arbitrage atr bollinger bands cci chart patterns classics copy trading courses day trading forex brokers forex charts forex ea forex education forex forecasting Forex Indicators forex software reviews grid trading hedging ichimoku macd market cycles news trading oscillators price action trading rsi social trading strategies tips & tricks trading bots trading platforms trend trading Video
  • Terms of Use
  • Privacy Policy
  • Compensation Disclosure
  • Risk Disclosure
  • About Us
  • Contact Us

Copyright © 2020 by ForexEzy.com

No Result
View All Result
  • Home
  • Getting Started with Forex
  • Forex Education
    • Forex Basics
    • Forex Trading Strategies
    • Money Management
    • Risk Management
    • Technical Analysis
    • Fundamental Analysis
    • Trading Psychology
    • Social Trading
    • Automated Trading
  • Forex Tools
    • Forex Robots
    • Forex Indicators
    • Forex Signals
  • Top Forex Brokers
  • Top Forex Robots
  • Commentary
  • Blog

© 2020, Forexezy.