Day trading is one kind of trading style in which a day trader usually opens and closes all positions on the same day. In this type of trading, traders do not hold any overnight position.
It is a short term trading technique but a bit longer term than scalping. Most of the day traders use 15 minutes, 30 minute or hourly charts for trading.
There are various simple trading strategies for day trading. These simple trading strategies are based on simple charts and indicators. Simple trading strategies are suitable for short term trading as these are easy and require less time to understand.
A day trader might not have much time to think after getting a trading signal. So, he/she should adopt a simple trading strategy for day trading. Before we discuss on the trading strategy, we should discuss a little on the indicators used.
Indicators used: EMA10, EMA30, and Heiken Ashi Candlesticks.
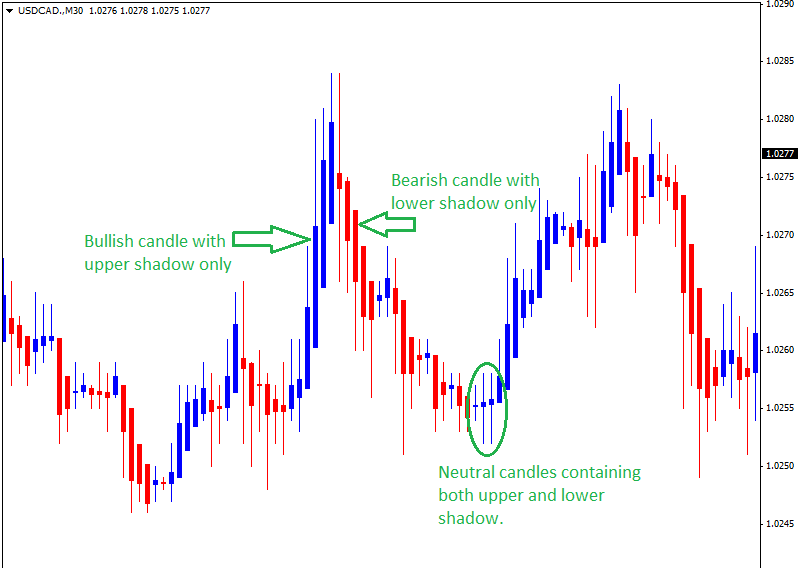
Heiken Ashi Candlesticks: Heiken Ashi candlesticks are quite different from normal candlesticks. Heiken Ashi candlesticks are very useful to determine short term trends and to determine buy and sell signals. The color of heiken ashi candlesticks can give us idea about bullishness and bearishness. When the candlestick is blue colored, then it is indicating bullishness.
Inversely, when heiken ashi candlestick is red colored, then it is indicating bearishness. Bullish candles have only upper shadow/leg and bearish candles have lower shadow/leg only. Heiken ashi candlesticks is neutral if the real body of the candle is small and it has both upper and lower shadow/leg.
Several frequent neutral candlesticks should be taken as a sign of trend reversal. Bullish and bearish heiken ashi candles have shown in the chart below.
Currency Pairs: All major currency pairs such as EUR/USD, AUD/USD, GBP/USD, USD/CAD and USD/CHF
Trading Session: Overlapping of London and New York Session or first 4 hours of New York session.
Time Frame: 30 minutes
Entry Conditions:
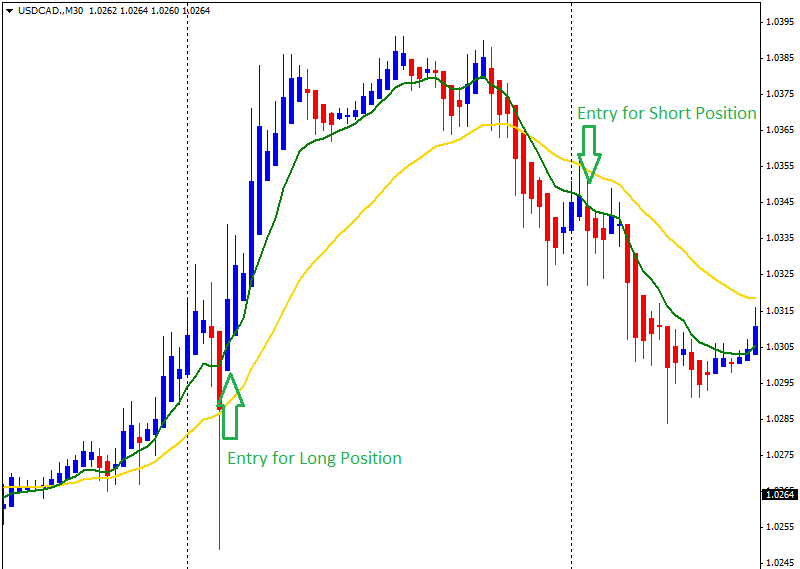
For long positions ,
- EMA10 should be above EMA30, and there should be a significant gap between these two moving averages
- Heiken ashi candles should come to the pullback zone (between EMA10 and EMA30)
- A bullish heiken ashi candlestick (blue colored)
For short positions,
- EMA10 should be below EMA30, and there should be a significant gap between these two moving averages.
- Heiken ashi candles should come to the pullback zone (between EMA10 and EMA30)
- A bearish heiken ashi candlestick (red colored)
Stop Loss:
- Place a stop loss at the value of EMA30.
- Or, fixed stop loss at 20 pips.
Exit Strategy:
- A fixed take profit at 40 pips
Here is an example of this trading strategy in the chart of USD/CAD (given below),
Summary: This is a trading strategy based on pullback trading technique. This strategy is a trend following trading strategy, which provides entry signals in the direction of the major trend.
This strategy is capable of catching large profits if trailing stop or indicator based exit strategy is used to trail the profits. It will carry better result if used in favor of long-term trends (such as 4-hour trend).


