ForexEzy
No Result
View All Result
  • Top Forex Advisors
    • Best Forex Robots
    • Best Forex Signals
    • Best Managed Accounts
  • Top Forex Brokers
    • Best Forex Brokers
    • US Forex Brokers
    • UK Forex Brokers
    • MT4 Forex Brokers
    • MT5 Forex Brokers
    • Zero Spread Brokers
    • Best PayPal Brokers
    • TradingView Brokers
    • Social Trading Platforms
  • Top Review Platforms
  • Forex Education
    • Getting Started
    • Forex Basics
    • Forex Trading Strategies
    • Money Management
    • Risk Management
    • Technical Analysis
    • Fundamental Analysis
    • Trading Psychology
    • Social Trading
    • Automated Trading
  • Forex Tools
    • Forex Robots
    • Forex Indicators
    • Forex Signals
    • Forex VPS
  • Forex Forecast
  • Crypto
    • Best Crypto Exchanges
    • Best Crypto Bots
    • Crypto Guides & Forecasts
No Result
View All Result
ForexEzy
No Result
View All Result
The World’s Leading Social Trading Platform
Try now
Home Forex Education Technical Analysis

How to Trade Using Horn Bottoms in Bullish Markets

by Chintan Patel
April 16, 2021
in Technical Analysis
0
How to Trade Using Horn Bottoms in Bullish Markets
0
SHARES
11
VIEWS
Share on FacebookShare on Twitter
The Best Forex Robots Report Is Already Here!
best forex robots
Check out 30+ best expert advisors with daily updated live results and statistics
Click Here

Introduction

Horn bottoms are down-trending spikes on trading charts. The pattern consists of two spikes that are visible on the weekly charts. The spikes are divided by a week and indicate a bullish reversal in the short term. Traders will notice that taller or longer horn bottoms have better prediction performance as compared to shorter ones. There is an outperformance when the right horn is found within the trading range of the left horn (or a little shorter than the left horn). 

Identification guidelines

Horn bottom appearance on the GBP/AUD trading chart

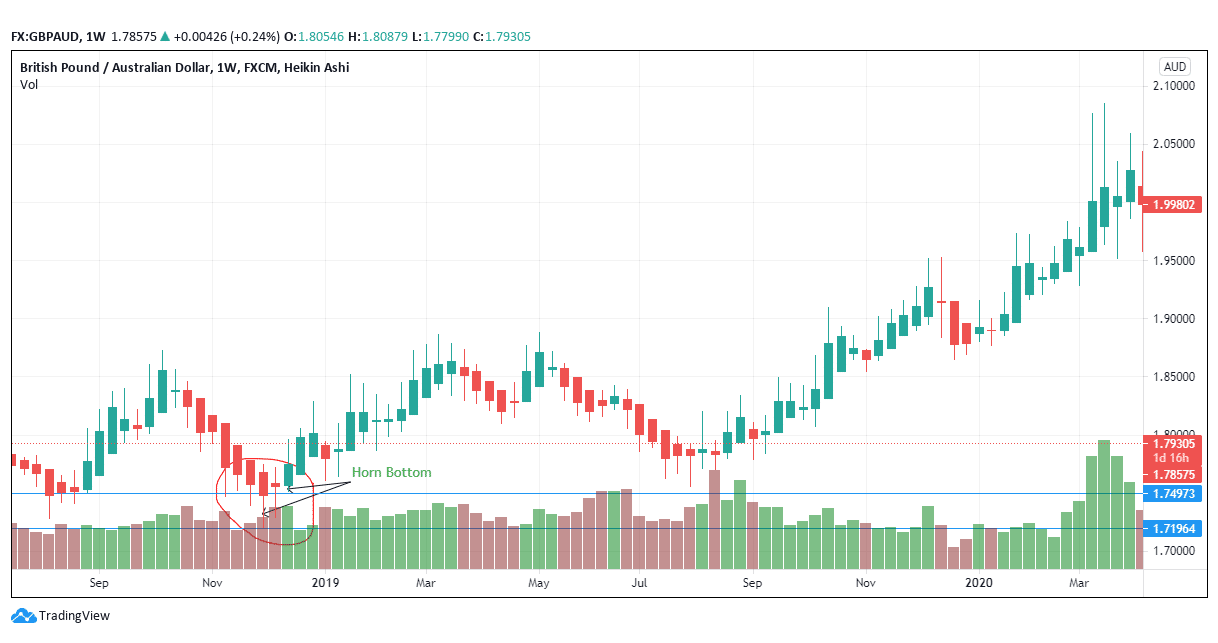
Figure 1: Horn bottom appearance on the GBP/AUD trading chart

The chart pattern in figure 1 shows how the down-trending left horn or spike is separated by a week from an up-trending right horn. The left horn reaches a low of 1.7196 while the right horn is at 1.7497. The failure rates associated with horns are low, meaning that traders will trade in a correct pattern after identifying them. Horn tops tend to signify a bearish turn, while horn bottoms indicate a bullish turn. 

  1. Use a weekly chart

To spot a horn bottom, use a weekly trading chart. While they may also appear on daily charts, the weekly performance helps the trader to track movement and ease selections. The left spike begins on a downtrend. Note that the right horn is separated by a week. 

Horn bottom on GBP/EUR pair- weekly performance

Figure 2: Horn bottom on GBP/EUR pair- weekly performance

In figure 2, the weekly chart is well elaborated- it has been enhanced to help spot the horn bottoms and the separation point. The left spike is formed from a short down-sloping trend. The price declines for a week before forming the horn bottom. The left spike starts on December 7, 2020, while the right spike is on December 21, 2020. 

Uptrend before a short price down-trend leading to horn bottom

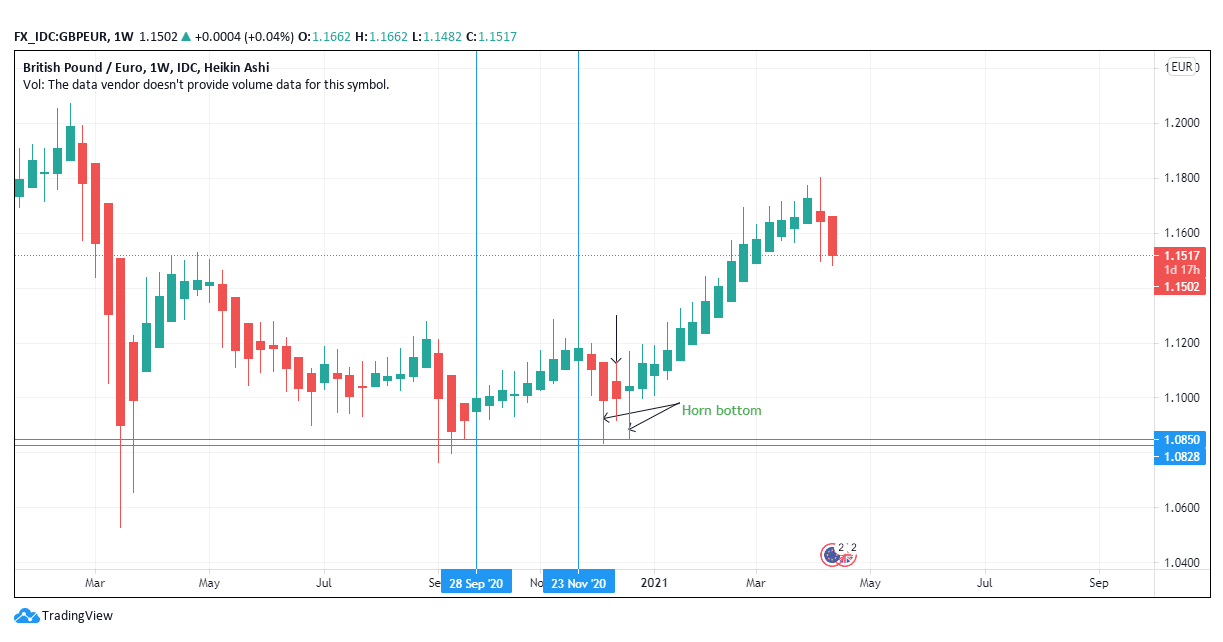
Figure 3: Uptrend before a short price down-trend leading to horn bottom

  1. Chart visibility

The weekly separation occurred on December 14, 2020. Notice that the closing price on the left spike is 1.0828 while the right spike is at 1.0850- slightly above but within the trading range. 

The prior down-trend of price forming the left spike as noted can either be long or short. However, the determining factor is the length of the spike as opposed to the length of the prior price movement.        

In figure 3, a clear depiction shows that there is a longer uptrend before the weekly down movement that gives way to the horn bottom. There is an uptrend from September 28, 2020, until November 23, 2020. This long uptrend is only separated from the horn bottom pattern by a week. Further, the bottom forms a significant bullish reversal pattern.

  1. Confirmation 

The horn bottom is confirmed after the price closes above the highest point in the three-week pattern formation. 

Confirmation price of the horn bottom

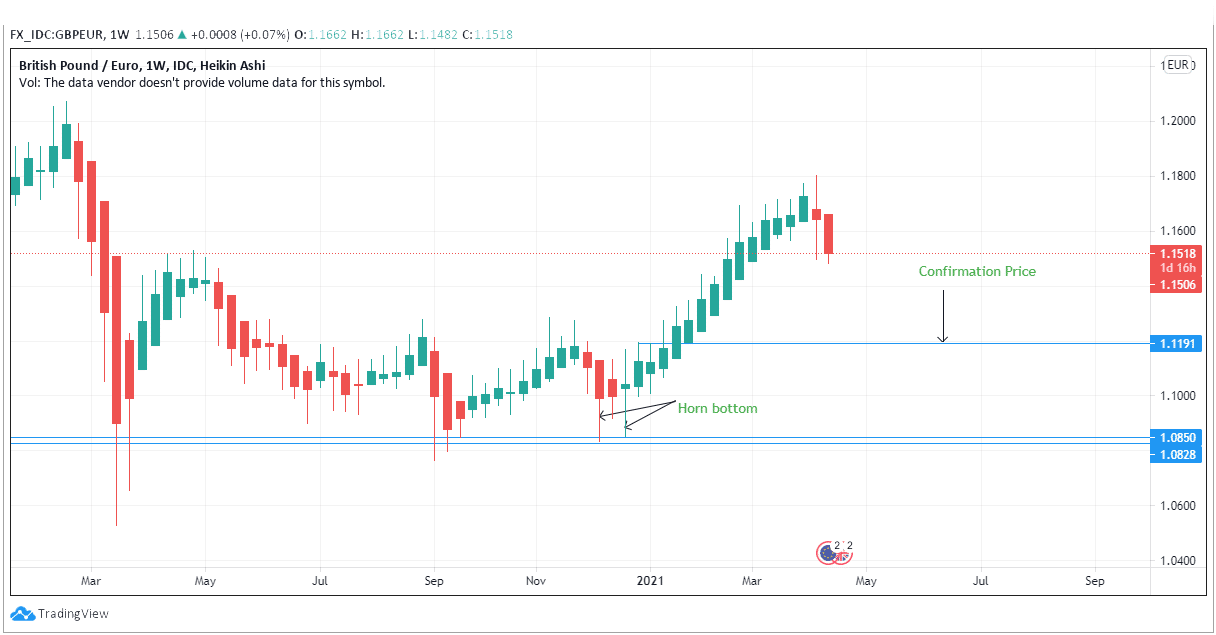
Figure 4: Confirmation price of the horn bottom

The price closes above the highest (high) position in the spike pattern. Figure 4 indicates that the confirmation price is at 1.1191. This confirmation validates the horn bottom pattern. The confirmation also helps the trader to go long. It signals a short-term bullish reversal trend. 

Trading strategy

  1. Computation of the price target 

The target price in an upward breakout is calculated by first subtracting the highest price of the three bars forming the horn bottom (H1) with the lowest point of the pattern (L1). The resulting figure should then be multiplied by 70%. 

[(H1-L1) * 70%]
Target Price Computation in GBP/EUR

Figure 5: Target Price Computation in GBP/EUR

In figure 4, the highest price (H1) in the horn bottom forms at 1.1173, slightly below the confirmation line. This price is subtracted to the lowest price (L1) of the horn bottom at 1.0850. The difference is 0.0323. Take this price and multiply it to 70% or 0.7. Add the result to the confirmation price. The price target becomes 1.1417. A look at figure 4 shows that the price continues to move above the target, further confirming the valid nature of the horn bottom. 

  1. Watch for the volume change 

The volume recedes as the chart forms the horn bottom. The decrease in volume in the pattern should prepare the trader to execute a long trade or prepare a buy move. The volume is higher before the pattern as the bottom movement takes shape. 

You will notice that the volume continues to rise after shifting in a bullish trend. The breakout volume is also high as the chart lengthens the price difference in the trading chart. In the case where the pattern forms in a prior bullish market the difference in performance will be minimal. 

Further, the trader will need to establish if the right spike is within the trading range of the left spike. In this case, the right spike has to have a lower high as compared to a higher low (see figure 4).

The price should climb immediately after the twin spikes appear. The trader can wait for two weeks if the price does not climb as quickly after the formation of the horn bottom. In most cases, the bottom appears in the yearly low points. However, the trader should not wait for the yearly low to identify the trend shift. Action should be taken as soon as prices change from a bullish to a bearish trend or a retracement in the chart pattern. 

  1. Use a stop Loss 

Place the stop-loss option at most $1 below the lowest price point in the horn pattern when trading stocks. On average, place the stop-loss at most 20 pips when trading forex due to the minimum expected price move. The price may decide to retest the low position before the formation of the pattern rather than proceeding with the uptrend. The stop loss will protect you from the unexpected retest. 

Conclusion

The horn bottom pattern represents a bullish reversal pattern. The confirmation line above the highest high in the pattern validates the pattern. The trader can decide to compute the price target before initiating the buy option. Place the stop-loss below the lowest low of the pattern to avoid the consequences of a retest.

The Best Forex Robots Report Is Already Here!
best forex robots
Check out 30+ best expert advisors with daily updated live results and statistics
Click Here
ShareTweet
Previous Post

GBP/AUD: Pair Drops After Stalled FTA Negotiations

Next Post

FX Oxygen Review

Related Posts

Trading With Balance of Power Indicator

Trading With Balance of Power Indicator

by Adam Stanley
December 9, 2021
0

The Balance of Power (BOP) indicator is an analysis tool created by Igor Livshin in August 2001. It tracks the...

What Are Pennant Chart Patterns in Forex: Step by Step Guide

What Are Pennant Chart Patterns in Forex: Step by Step Guide

by Chintan Patel
November 15, 2021
0

Continuation patterns in the forex market are a common occurrence whenever there is a large movement in one direction followed...

How To Trade Ascending Scallops in Forex

How To Trade Ascending Scallops in Forex

by Adam Stanley
November 10, 2021
0

Price in the Forex market does not always move in one direction. After a significant move in one direction, up...

Inverted Scallops in Forex Chart Patterns: Step by Step Guide

Inverted Scallops in Forex Chart Patterns: Step by Step Guide

by Adam Stanley
November 9, 2021
0

Whenever prices move up significantly in the forex market, exhaustion often kicks in. In most cases, the fatigue is usually...

Elder’s Method in Forex Trading

Elder’s Method in Forex Trading

by Tim Baudin
November 3, 2021
0

There are several strategies that traders and analysts have developed over the years, all in a bid to milk the...

Load More

Leave a Reply Cancel reply

Your email address will not be published. Required fields are marked *

Best Forex Automated Systems

  • TechBerry 9/10
  • Happy Galaxy 8.5/10
  • Forex Cyborg 8.5/10
  • Forex Fury 8/10
  • FXgoodway 7.5/10
  • Best Forex Brokers
  • Best Forex Robots
  • Best Forex Signals
  • Best Forex Managed Accounts

Top Trading Markets

We are dedicated to demystify the world of forex trading for you – no matter what level you are on.

Categories
  • Automated Trading
  • Crypto Robot Review
  • Cryptocurrency Trading
  • Day Trading
  • Forex Basics
  • Forex Brokers
  • Forex Education
  • Forex Forecasts
  • Forex Indicators
  • Forex Market Commentary
  • Forex Robots
  • Forex Signals
  • Forex Signals
  • Forex Tools
  • Forex Trading Strategies
  • Forex VPS
  • Fundamental Analysis
  • Managed Accounts
  • Money Management
  • News
  • Review
  • Review Platforms
  • Risk Management
  • Social Trading
  • Technical Analysis
  • Top World Traders
  • Trading Apps
  • Trading Psychology
  • Uncategorized
Tags
Acquisition AI Amazon Apple Artificial Intelligence Bitcoin bond yields CEO China earnings earnings report economy Electric Vehicles Federal Reserve financial performance Financial Results forex ea forex software reviews Growth Guidance Housing Market inflation interest rates Investing investment Investors Market Volatility merger mortgage rates net profit Nvidia Oil prices Q2 Results revenue Revenue Growth Sales sales growth Stock Futures stock market stock performance Stocks strategies technology Tesla Video
  • Terms of Use
  • Privacy Policy
  • Compensation Disclosure
  • Risk Disclosure
  • About Us
  • Contact Us

Copyright © 2023 by ForexEzy.com

No Result
View All Result
  • Top Forex Advisors
    • Best Forex Robots
    • Best Forex Signals
    • Best Managed Accounts
  • Top Forex Brokers
    • Best Forex Brokers
    • US Forex Brokers
    • UK Forex Brokers
    • MT4 Forex Brokers
    • MT5 Forex Brokers
    • Zero Spread Brokers
    • Best PayPal Brokers
    • TradingView Brokers
    • Social Trading Platforms
  • Top Review Platforms
  • Forex Education
    • Getting Started
    • Forex Basics
    • Forex Trading Strategies
    • Money Management
    • Risk Management
    • Technical Analysis
    • Fundamental Analysis
    • Trading Psychology
    • Social Trading
    • Automated Trading
  • Forex Tools
    • Forex Robots
    • Forex Indicators
    • Forex Signals
    • Forex VPS
  • Forex Forecast
  • Crypto
    • Best Crypto Exchanges
    • Best Crypto Bots
    • Crypto Guides & Forecasts

© 2023, Forexezy. {copy} {year}