Introduction to Ichimoku charts
The foreign exchange (forex) market is the most exciting, but it could be grueling some times. In particular, you have to be at your best whenever developing trading strategies. It is the only way you can have the assurance of earning something from the market. Luckily, numerous forex charting tools provide invaluable support during trading. One of these tools is the Ichimoku indicator.
Typically, the best forex indicators are the products of expert traders who have years of experience in the market. However, some indicators like Ichimoku originate from elsewhere, but they are finding great usage in the forex market. Initially developed by a Japanese journalist who specialized in trading equities in the ’60s, this indicator is growing in popularity among forex traders. It is because it is more versatile than any other forex indicator.
Ichimoku Kinko Hyo, as it is officially known, performs four tasks simultaneously. In the first place, the indicator defines the most strong resistance and support levels in the market. The indicator uses two lines (a 9-day moving average line and a 26-day moving average) to define a moving average crossover. Essentially, this is similar in practice to the MACD indicator. Secondly, Ichimoku uses two leading lines (Leading Span A and Leading Span B) to identify and to define the trend of the price action.
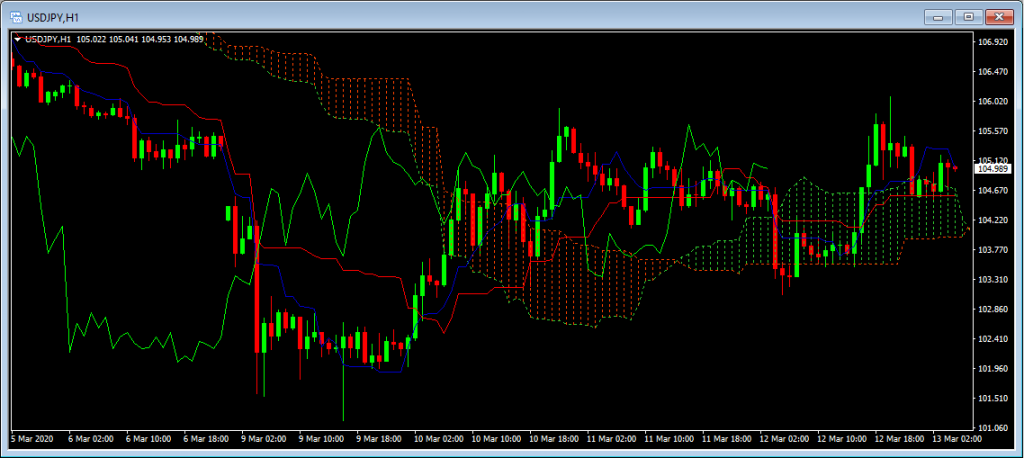
These leading lines also define an Ichimoku cloud, which gauges the momentum of price action. It is the third task of Ichimoku charts. Fourthly, the indicator provides reliable entry and exit points during trading. The figure below shows the full Ichimoku chart of the USD/JPY pair.

In the chart, the blue line represents the 9-day moving average (otherwise called Tenkan-sen or Conversion Line), the red line is the 26-day moving average (otherwise called Kijun-sen or Base Line). The shaded region is the Ichimoku cloud (Kumo). On either side of the Ichimoku cloud,two lines act as boundaries. The green line is the Leading Span A, which is faster. It is because it plots the average of the Tenkan-sen and the Kijun-sen. The red boundary is the slower line called Leading Span B, and it plots the average of the sum of the 52-day high and 52-day low. All the leading span lines are plotted 26 days ahead hence enabling Ichimoku chart to predict market sentiment.
How to use Ichimoku in price action trading
Price action trading is the most popular strategy in the forex market because it is easy to analyze. Even forex expert advisors can generate and act on trading signals easily when following the price action strategy. The beauty of the Ichimoku charts, sometimes called the equilibrium chart, is that they enable different trading styles. A trader can use the conversion line and the baseline for scalpingand the Ichimoku cloud for trend trading. Let us see an example.
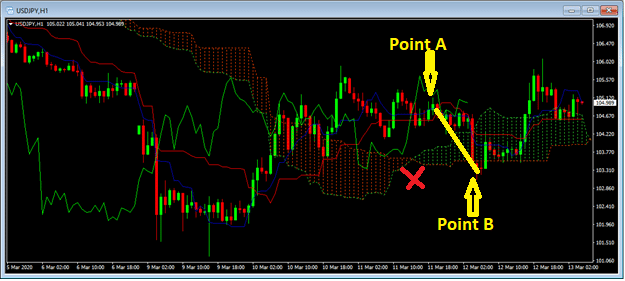
In the figure below, the USDJPY pair enter an uptrend at the point marked X. However, the Conversion Line (blue line) moves below the Base Line (red line) at Point A. Definitely, this is a signal that the price action is about to move down but in the short term. If you are a scalper, you had an opportunity to short the pair and then collect your profits before the pair reaches Point B.

However, a trend trader would just have entered the market at the point marked X and then waited. As you can see, the Ichimoku cloud is still green since turning from red at the Point X. Another one of money-making hacks using Ichimoku is to use the Conversion Line and the Base Line to enter the market and then use the Ichimoku cloud to exit.
In the chart above, the Conversion Line crosses under the Base Line at Point A. This is a signal that the market is going bearish. However, the Ichimoku cloud is still green, signifying that the overall trend in the market is bullish. In this case, you are better off waiting for a more reliable signal before making your move. The signal comes at Point B, where the Ichimoku cloud provides support for the pair. Once the signal appears, you can now enter a buy position at Point B because the uptrend has solidified.
Final Thoughts
Ichimoku Kinko Hyo might seem complicated at first sight. As you have seen, this is one of the easiest indicators and one of the best-kept forex trading secrets. In particular, the Ichimoku chart shows more data points than any other forex trading indicator. It, therefore, follows that the price action provided is the most reliable.
Further, the indicator performs functions of almost four indicators. Firstly, it plays the role of the MACD indicator through the Conversion Line and the Base Line. Secondly, the Ichimoku cloud identifies the direction of the trend. Thirdly, the Ichimoku cloud, acting together with the Conversion Line and the Base Line, provides the most reliable trade signals.


