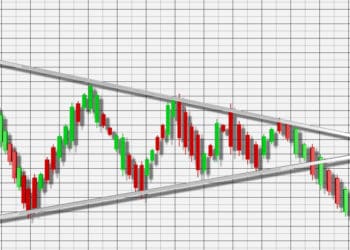
Technical analysis is a method to analyze the future possible direction of price movement of currency pairs or securities or other financial assets by using past market data, primary price, and volume.
Technical analysts use charts, indicators, and other drawing tools to understand the future possible price movements and its direction.
Technical analysis has become very popular for the short term, midterm and long term trading. Like other financial markets, technical analysis is widely used in the forex market. Technical analysts develop trading rules and trading systems by using various indicators, theories and charting tools to analyze the currency pairs in the forex market.
Technical analysts focus on price actions rather than the fundamental condition of the currency pair. However, technical analysis can be combined with fundamental analysis to obtain a better result.
Basic Assumptions of Technical Analysis:
There are some basic assumptions of technical analysis. These are,
Price discounts everything:
Technical analysts believe that all the relevant information is already reflected in the price. This is why technical analysts tend to understand mass traders’ sentiment on this relevant information which has already reflected in the price of that asset or currency.
Price moves in trends:
Technical analysts believe that price moves in trend. A trend can be an uptrend, downtrend or flat. An uptrend means an upward direction of price in a long timeframe. Inversely, a downtrend reflects a long-term downward movement of price.
The trend is considered as flat or ranging when the market is stuck in a range and not moving in any specific direction. In this case, it is considered that there is no trend. Here is an example chart of trends (uptrend, downtrend and flat) in the daily chart of EUR/USD (given below).
An uptrend can be identified by drawing an upward trend line by joining the higher low points. A downtrend can be identified by finding lower high points or by drawing a downward trend line by joining the lower high points. When the price lies between a horizontal support and resistance lines, then it is considered as a flat trend.
History tends to repeat itself:
This is another basic assumption of technical analysis. Technical analysts believe that history tends to repeat itself in the present and future price movements. This repetition may not be done in exact price or exact time. Usually, history repeats itself in forms of chart patterns or situation.
These chart patterns and the situation can be found in past, present and future. Some patterns and situations are bullish in nature and responsible for positive price movements. Some chart patterns are bearish in nature and responsible for negative price movements.
Summary:
Technical analysis is not an exact science. So, you cannot win every time you trade with technical analysis, but most of the trades will be winners as technical analysis increases the winning probability. There are different styles and trading methods in technical analysis and traders should choose among these according to their trading personality.
Money management and trading psychology play a vital role in trading success. Using technical analysis without discipline and proper money management will lead you to the losing side in the long run.


