Technical traders require technical charts for forex trading. Technical charts are available in most of the trading platform offered by forex brokers. A technical analyst understands the movement of the market and takes a trading decision by observing these charts.
There are different types of technical charts. Three types of charts are available in most trading platforms for forex trading. These charts are,
- Line Chart
- Bar Chart
- Candlestick Chart.
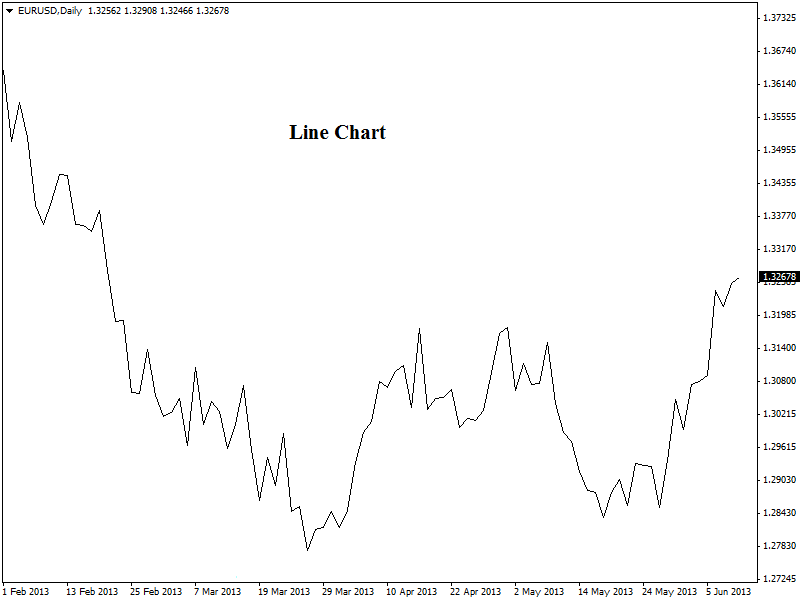
Line Chart:
Line chart appears as a line which is developed by joining the closing prices. This type of chart is particularly useful to observe and understand the trends of the market quickly. This chart is helpful for understanding the major movements only.
It is not suitable to take trading decisions by this type of chart. However, this line chart can generate buy and sell signals when crossovers with moving averages occur. Here is an example of a line chart in the daily chart of EUR/USD (given below).
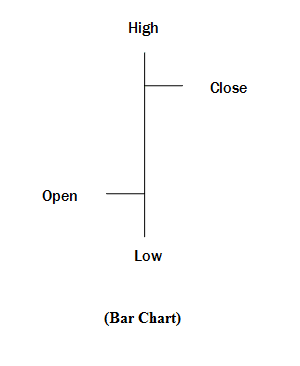
Bar Chart:
A bar chart consists of price bars for each time period. These bars are developed based on the 4 price data; open, high, low and close. Bar charts are often called as OHLC charts (open, high, low, close charts).
If you plot a daily bar chart, then you will get one bar for each day. The construction of a bar chart has shown in the figure below,
Now, here is the example of a bar chart in the daily chart of EUR/USD (given below).
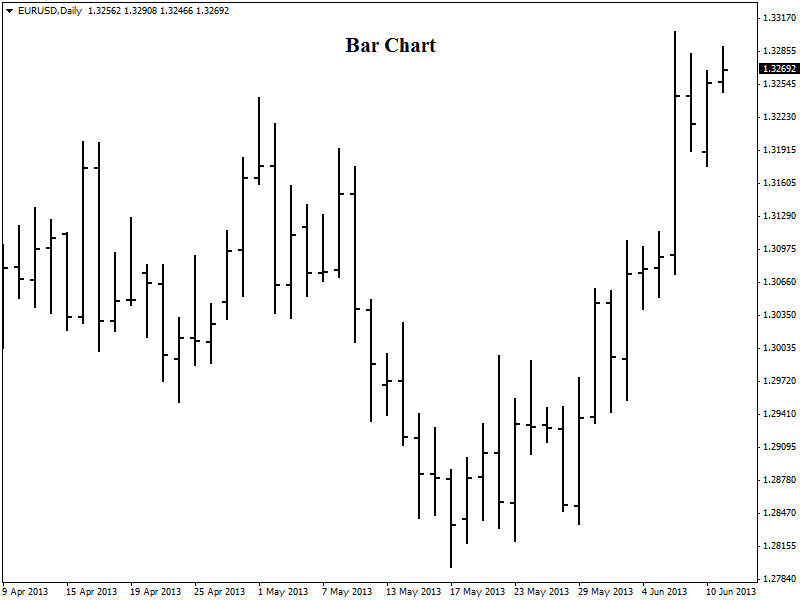
Bar charts are very useful to draw trend lines. This type of chart can also detect short-term breakouts.
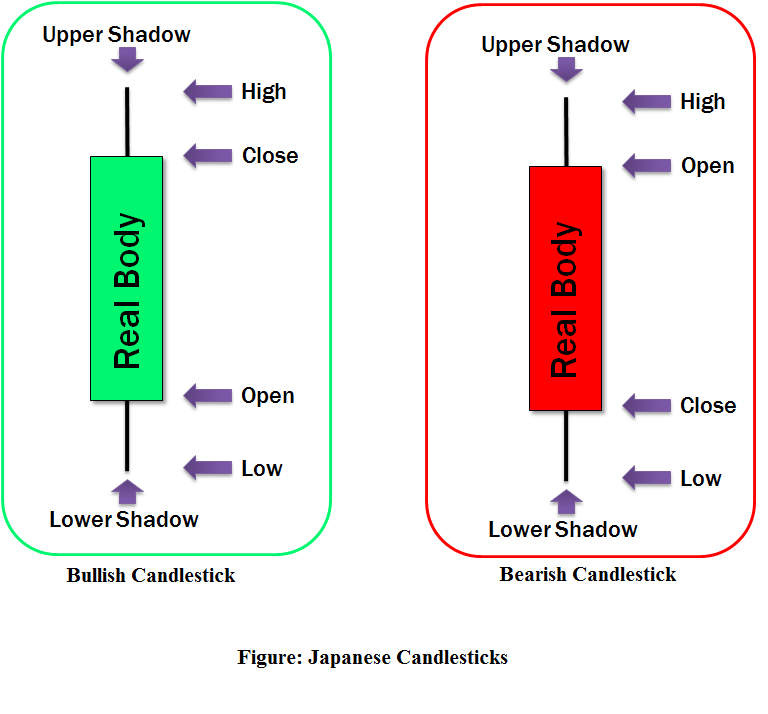
Candlestick Chart:
A candlestick chart consists of Japanese candlesticks for each time period. These candlesticks are constructed with same data as bar charts (open high, low and close price). A candlestick has two parts; one is the real body another is shadow or leg.
Candlesticks can be either bullish or bearish depending on the open and close price. The shadow or leg is similar for a bullish and bearish candlestick, but the real body is different for a bullish and bearish candlestick. The construction of a candlestick has given in the figure below.
Here is an example of candlestick chart in the daily chart of EUR/USD (given below). Here, a candle consists the open, high, low and close price data of one day as it is in daily time frame.
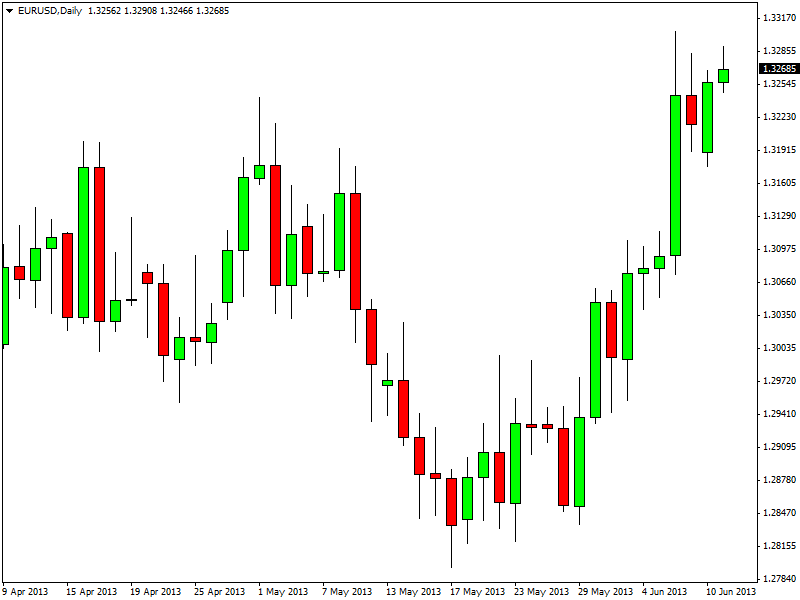
Candlestick charts are very useful and widely used charts in technical analysis. This type of chart helps a trader to identify the trend, support-resistance, and trend lines and buy/sell signals. Most traders use other indicators and charting tools with this candlestick chart to develop a trading strategy and trading rules.
These candlesticks have different candlestick patterns. These patterns are different in shape and indicate future possible price movement.
Summary:
There are other charting methods, but those are rarely used in forex trading. Line charts, bar charts, and candlestick charts are most common and widely used charts.
Among these three, candlestick charts are very popular and widely used in technical analysis and forex trading. Almost every trader use candlestick charts with other technical indicators to analyze the market.


