ForexEzy
No Result
View All Result
  • Top Forex Advisors
    • Best Forex Robots
    • Best Forex Signals
    • Best Managed Accounts
  • Top Forex Brokers
    • Best Forex Brokers
    • US Forex Brokers
    • UK Forex Brokers
    • MT4 Forex Brokers
    • MT5 Forex Brokers
    • Zero Spread Brokers
    • Best PayPal Brokers
    • TradingView Brokers
    • Social Trading Platforms
  • Top Review Platforms
  • Forex Education
    • Getting Started
    • Forex Basics
    • Forex Trading Strategies
    • Money Management
    • Risk Management
    • Technical Analysis
    • Fundamental Analysis
    • Trading Psychology
    • Social Trading
    • Automated Trading
  • Forex Tools
    • Forex Robots
    • Forex Indicators
    • Forex Signals
    • Forex VPS
  • Forex Forecast
  • Crypto
    • Best Crypto Exchanges
    • Best Crypto Bots
    • Crypto Guides & Forecasts
No Result
View All Result
ForexEzy
No Result
View All Result
The World’s Leading Social Trading Platform
Try now
Home Forex Education Forex Trading Strategies

Multi-time frame Analysis in Forex Trading

by Tim Baudin
February 23, 2021
in Forex Trading Strategies
0
Multi-time frame Analysis in Forex Trading
0
SHARES
11
VIEWS
Share on FacebookShare on Twitter

Multiple time frame analysis (MFA) is a type of technical and price action analysis that involves looking at a currency pair across several time frames. The strategy, also known as a multi-time analysis, is widely used by all types of professionals, including scalpers and swing traders. In this article, we will look at the best strategies to use when conducting this type of analysis.

The Best Forex Robots Report Is Already Here!
best forex robots
Check out 30+ best expert advisors with daily updated live results and statistics
Click Here

Time frames in forex trading

There are four main types of forex traders. These traders use multiple time frames based on their risk appetite and trading strategies. They are:

  • Day traders – These are forex traders who buy and sell currency pairs several times a day. They always ensure that they don’t leave their open trades overnight. 
  • Scalpers – These are day traders who buy and sell currencies within a few minutes. Their goal is to make a small profit for each trade they initiate.
  • Swing traders – They are thematic traders who buy and sell currency pairs within a few days. 
  • Position traders – These are people who buy or sell currency pairs and hold the positions for several days. 

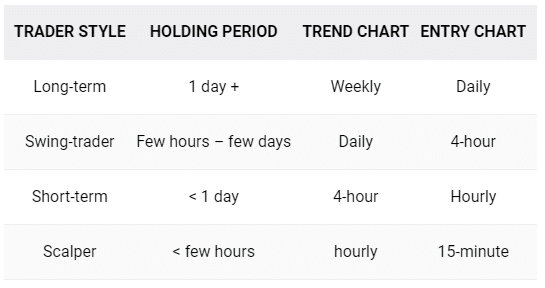
These traders use different types of charts on a daily basis. For example, scalpers tend to use ultra-short time frames that range from 1 minute to five minutes. They are generally not interested in the long-term trend of a chart. Similarly, position traders usually use long-term charts like daily or weekly charts. An ultra-time frame chart is not useful to them.

In general, scalpers focus on charts that are less than 10 minutes, while day traders use charts that are less than 1 hour. Swing traders, on the other hand, use between 4-hour and daily charts while long-term or position traders use daily and weekly charts. This is summarized in the chart below.

Typical time frames for different types of traders

Typical time frames for different types of traders

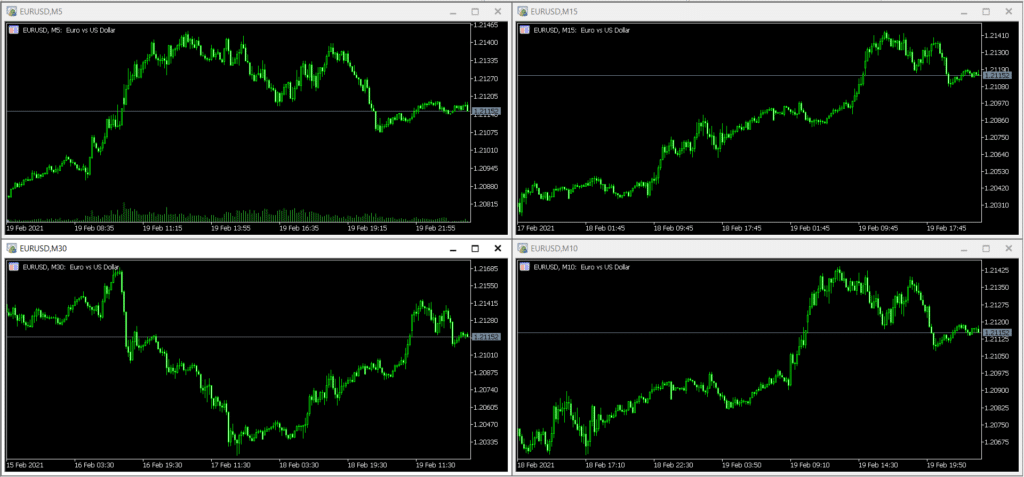
The chart below shows a EUR/USD chart with 1-hour, 30-minutes, 10-minutes, and 5 minutes.

Multi-time EUR/USD chart

Multi-time EUR/USD chart

How multi-time analysis works

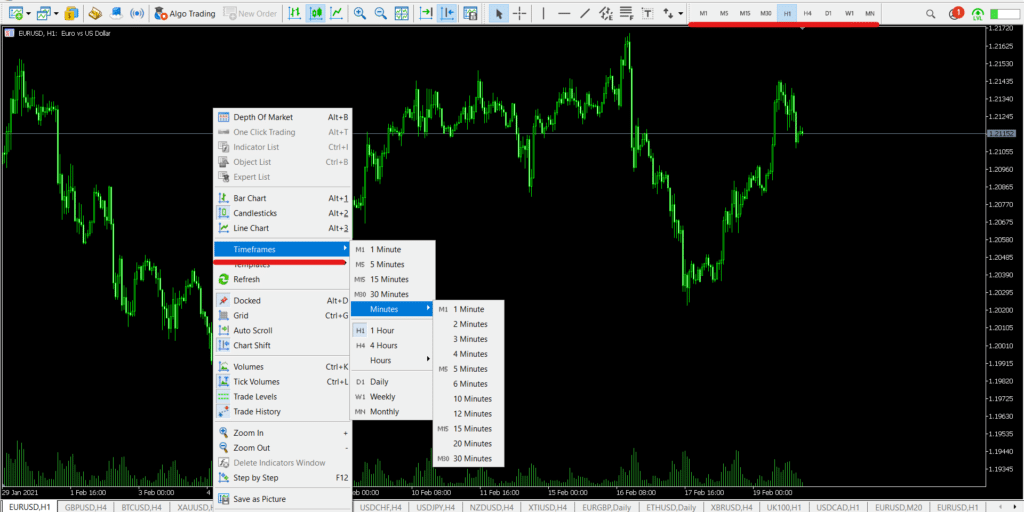
All trading platforms like the MetaTrader and TradingView have sections that help you change chart time frames. 

A key difference between MT4 and MT5 is the number of time frames that are offered. The MT5 platform has more time frames ranging from 1 minute to monthly. MT4 does not have some specific minutes. The chart below shows how you can change the time frame in MT5.

Time frames in MT5

Time frames in MT5

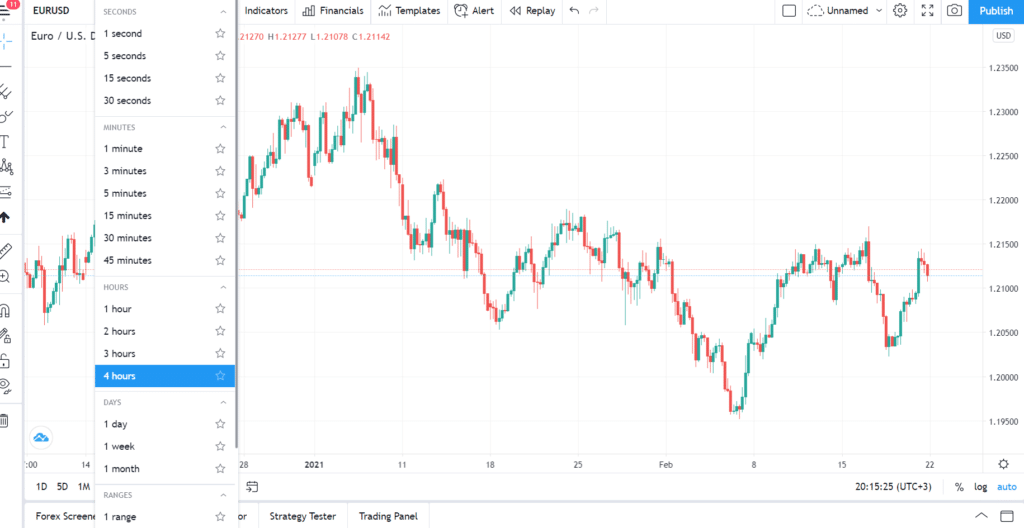
The chart below shows how to change time frames in TradingView.

Time frames in TradingView

Time frames in TradingView

There are two main ways of using the multi-time frame analysis in forex trading; top to bottom and bottom to top. 

In top to bottom, you start with a longer time frame chart and move down to the shorter time frame chart. On the other hand, in bottom to top, you start with a shorter time frame chart and expand it to a longer time frame chart. 

Multi-time analysis for day traders

As mentioned, day traders focus on opening and closing trades within a day. They always avoid leaving their trades overnight. In most cases, these traders use charts that are less than one hour to identify entry positions. 

For scalpers, a multi-time frame analysis can mean starting with an hourly chart and identifying key support and resistance levels. You then move to a 30-minute chart and identify more such levels. Then move to the 15-minute, 5-minute, and then to a 1-minute chart. 

There are two main benefits of using this approach. First, by starting with a long-term chart, you are able to identify the overall trend. Second, using the process helps you identify key support and resistance levels.

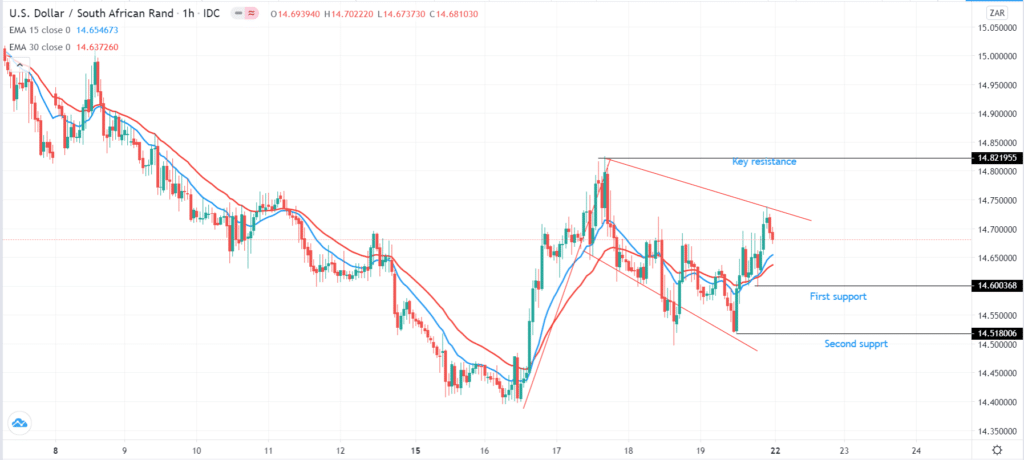
For example, the hourly chart below shows that the USD/ZAR has formed a bullish flag pattern. We have also drawn key support and resistance levels in black. Further, we have added the 25-period and 15-period exponential moving averages on the chart. In it, you can see that the price is above the two EMAs.

Hourly chart with support and resistance

Hourly chart with support and resistance

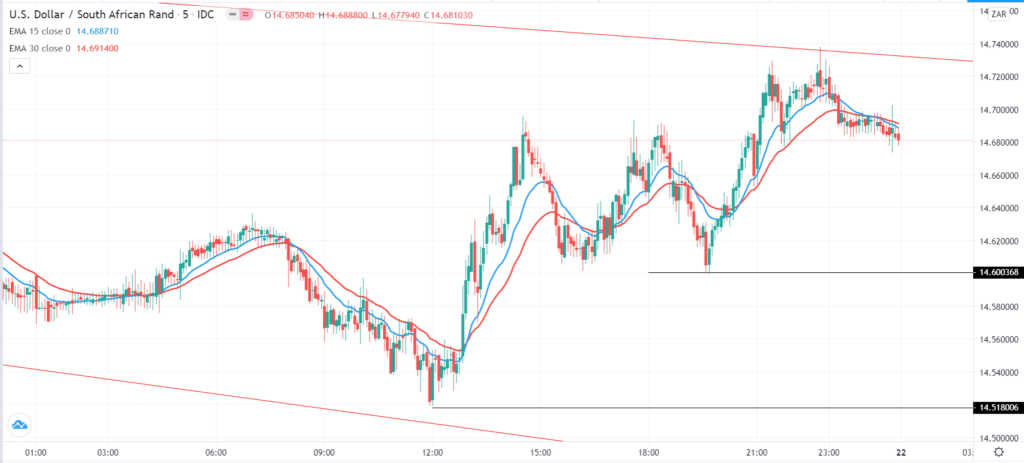
The chart below shows the same chart on the five-minute chart. Therefore, as a scalper, you can use the support and resistance lines identified in the hourly chart to position your trades. Also, the two moving averages have made a bearish crossover. As such, this is a sign that the pair may continue falling in the short term as bears target the support at 14.66.

USD/ZAR 5-minute chart

USD/ZAR 5-minute chart

Multi-time frame analysis for swing traders

Swing traders use longer time frames since they usually hold their trades for several days. In most cases, they use charts ranging from 30 minutes to 12 hours. Therefore, in multi-time frame analysis, they can start with the daily chart. This will help them understand the overall trend of the currency pair. They can then narrow it to a 12-hour chart, 6-hour chart, 4-hour chart, hourly, to 30-minutes.

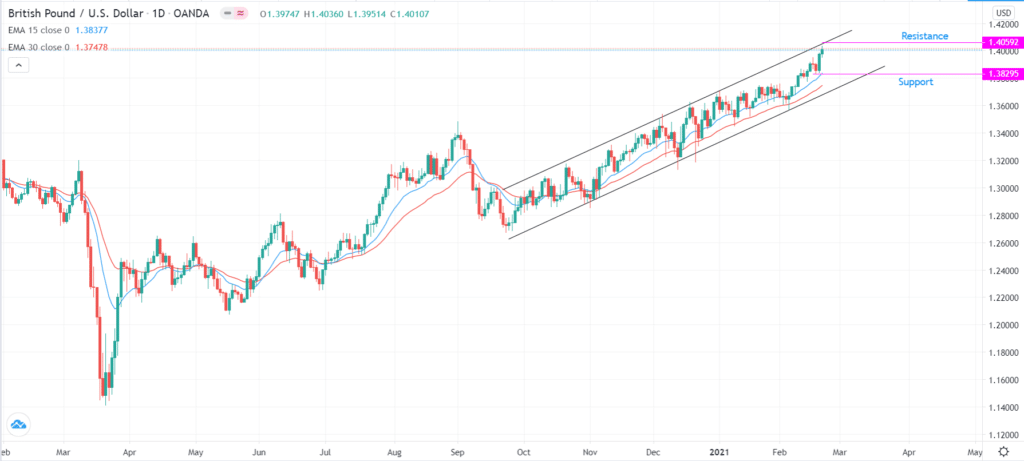
A good example of this is in the GBP/USD chart below. On the daily chart, we see that the pair is in an uptrend and has formed an ascending channel shown in black. The price is slightly above the upper side of the channel, which means that there is a potential for a pullback. 

GBP/USD daily chart

GBP/USD daily chart

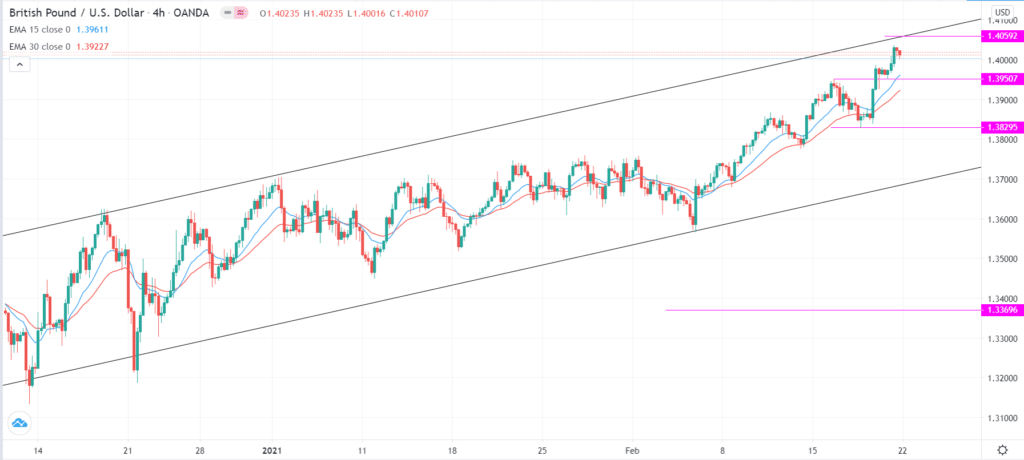
The four-hour chart below shows another support (1.3950) that is not visible on the daily chart. 

GBP/USD four-hour chart

GBP/USD four-hour chart

Multi-time frame analysis for long-term traders

These day traders or investors buy or sell their positions for a few days, weeks, or months. In their multi-time analysis, these traders start with a monthly chart and identify the long-term trend. They then narrow it to the weekly chart and then to the daily chart. Some even move further lower.

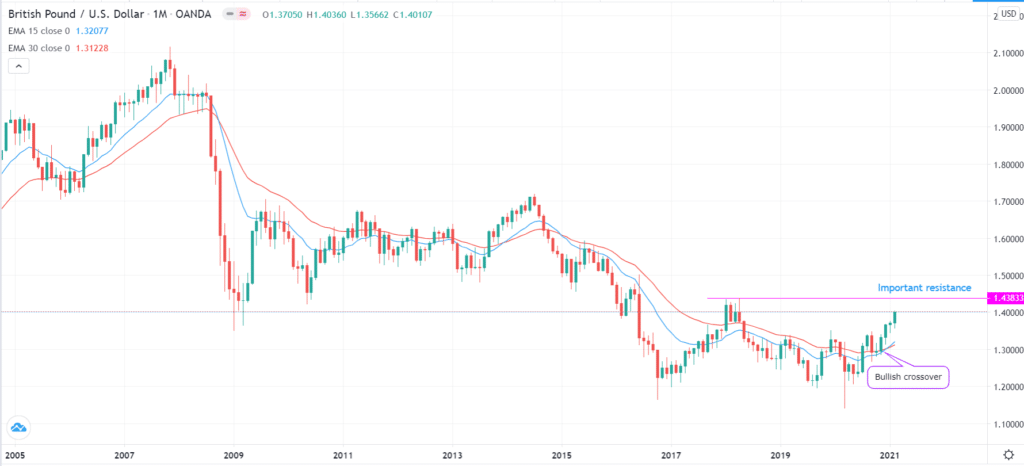
In the monthly chart, we see that the GBP/USD has been in a strong uptrend. But it is nearing a key resistance at 1.4383. Notably, the short and medium-term moving averages have also made a bullish crossover.

GBP/USD monthly chart

GBP/USD monthly chart

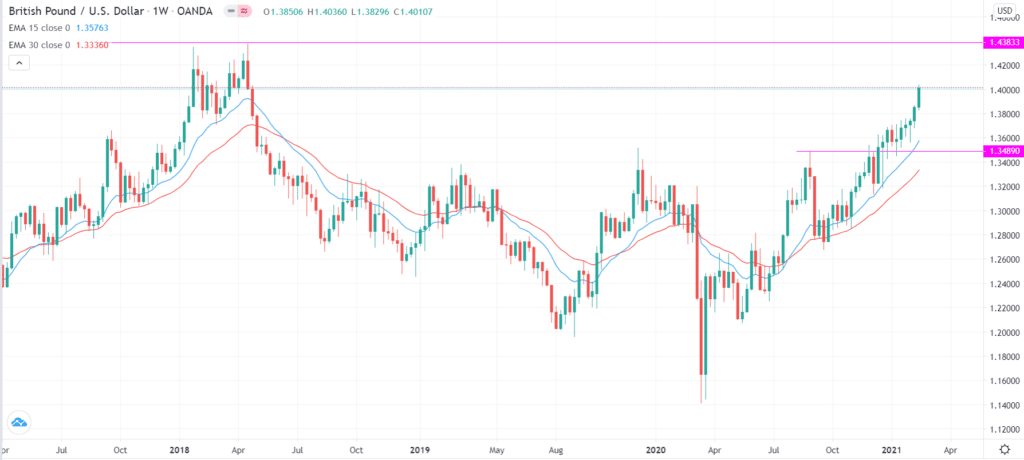
The weekly chart also reveals the above level as a key resistance. But it also reveals 1.3489 as a key support level. Therefore, a pullback to this support is possible in the near term.

GBP/USD weekly chart

GBP/USD weekly chart

Summary

Multiple time frame analysis is an important strategy because it shows you the bigger picture of a currency pair or any other asset. It also helps to show you the key support and resistance levels of the asset. We recommend that you always use the process in your analysis.

The Best Forex Robots Report Is Already Here!
best forex robots
Check out 30+ best expert advisors with daily updated live results and statistics
Click Here
ShareTweet
Previous Post

Very‌ ‌Well‌ ‌Trader Review

Next Post

USD/MXN: Mexican Peso Slumps As US Treasuries Rally Accelerates

Related Posts

Best 5 Leverage Calculators Use Can Use for Free

Best 5 Leverage Calculators Use Can Use for Free

by Chintan Patel
May 30, 2022
0

Leverage is an important concept in forex and stocks trading. It refers to the amount of money that a broker...

KeyDifferences Between the Simple and Exponential Moving Averages

KeyDifferences Between the Simple and Exponential Moving Averages

by Chintan Patel
April 18, 2022
0

Moving Averages (MAs) are often the first indicator introduced to a newbie in any financial market. They remain the bread-and-butter...

Best Strategies for Trading the Japanese Yen USDJPY

Best Strategies for Trading the Japanese Yen USDJPY

by Adam Stanley
April 6, 2022
0

The Japanese yen is one of the most popular currencies globally because of the position of the country’s economy. Japan...

Best Strategies for Trading the Swiss Franc USDCHF

Best Strategies for Trading the Swiss Franc USDCHF

by Chintan Patel
April 4, 2022
0

The Swiss franc is a popular currency around the world today. It is often viewed as a safe-haven currency because...

How to trade using Larry Connor

How To Make Money Using 2-Period RSI Strategy

by Adam Stanley
February 16, 2022
0

2-Period RSI strategy is a common trading strategy that traders and forex expert advisors leverage to squeeze profits while trading...

Load More

Leave a Reply Cancel reply

Your email address will not be published. Required fields are marked *

Best Forex Automated Systems

  • TechBerry 9/10
  • Happy Galaxy 8.5/10
  • Forex Cyborg 8.5/10
  • Forex Fury 8/10
  • FXgoodway 7.5/10
  • Best Forex Brokers
  • Best Forex Robots
  • Best Forex Signals
  • Best Forex Managed Accounts

Top Trading Markets

We are dedicated to demystify the world of forex trading for you – no matter what level you are on.

Categories
  • Automated Trading
  • Crypto Robot Review
  • Cryptocurrency Trading
  • Day Trading
  • Forex Basics
  • Forex Brokers
  • Forex Education
  • Forex Forecasts
  • Forex Indicators
  • Forex Market Commentary
  • Forex Robots
  • Forex Signals
  • Forex Signals
  • Forex Tools
  • Forex Trading Strategies
  • Forex VPS
  • Fundamental Analysis
  • Managed Accounts
  • Money Management
  • News
  • Review
  • Review Platforms
  • Risk Management
  • Social Trading
  • Technical Analysis
  • Top World Traders
  • Trading Apps
  • Trading Psychology
  • Uncategorized
Tags
Acquisition AI Amazon Apple Artificial Intelligence Bitcoin bond yields CEO China earnings earnings report economy Electric Vehicles Federal Reserve financial performance Financial Results forex ea forex software reviews Growth Guidance Housing Market inflation interest rates Investing investment Investors Market Volatility merger mortgage rates net profit Nvidia Oil prices Q2 Results revenue Revenue Growth Sales sales growth Stock Futures stock market stock performance Stocks strategies technology Tesla Video
  • Terms of Use
  • Privacy Policy
  • Compensation Disclosure
  • Risk Disclosure
  • About Us
  • Contact Us

Copyright © 2023 by ForexEzy.com

No Result
View All Result
  • Top Forex Advisors
    • Best Forex Robots
    • Best Forex Signals
    • Best Managed Accounts
  • Top Forex Brokers
    • Best Forex Brokers
    • US Forex Brokers
    • UK Forex Brokers
    • MT4 Forex Brokers
    • MT5 Forex Brokers
    • Zero Spread Brokers
    • Best PayPal Brokers
    • TradingView Brokers
    • Social Trading Platforms
  • Top Review Platforms
  • Forex Education
    • Getting Started
    • Forex Basics
    • Forex Trading Strategies
    • Money Management
    • Risk Management
    • Technical Analysis
    • Fundamental Analysis
    • Trading Psychology
    • Social Trading
    • Automated Trading
  • Forex Tools
    • Forex Robots
    • Forex Indicators
    • Forex Signals
    • Forex VPS
  • Forex Forecast
  • Crypto
    • Best Crypto Exchanges
    • Best Crypto Bots
    • Crypto Guides & Forecasts

© 2023, Forexezy. {copy} {year}