ForexEzy
No Result
View All Result
  • Home
  • Forex Education
    • Forex Basics
    • Forex Trading Strategies
    • Money Management
    • Risk Management
    • Technical Analysis
    • Fundamental Analysis
    • Trading Psychology
    • Social Trading
    • Automated Trading
  • Forex Tools
    • Forex Robots
    • Forex Indicators
    • Forex Signals
  • Top Forex Brokers
  • Top Forex Robots
  • Commentary
  • Blog
No Result
View All Result
ForexEzy
No Result
View All Result
Home Forex Education Forex Trading Strategies

New York Close Charts in Forex – Why Are They Important for Daily Time-Frame Price Action?

by Adam Stanley
March 19, 2021
in Forex Trading Strategies
0
New York Close Charts in Forex – Why Are They Important for Daily Time-Frame Price Action?
0
SHARES
11
VIEWS
Share on FacebookShare on Twitter

Trading forex is a game of fine margins. Any trader seeks to find clarity in their technical analysis. Interestingly, the data on forex charts is not exactly the same across the board due to the different data feeds that brokers receive.

The most common type of chart is the New York close (referred to as such because the daily candle closes at 5 p.m. EST, the end of the New York session), which is the preferred choice. This is also the one used by a vast majority of brokers. 

The other kind of chart (though not very common) is the GMT close (Greenwich Meridian Time) that contains six daily candles instead of five that represent the equivalent days of the forex week.

There are some slight nuances between the two that, while they may seem insignificant, have a bearing in how daily time-frame traders (particularly if they are using price action) analyze the markets.

Table of Contents

  • Understanding the opening and closing times of the forex market
  • The difference between a GMT close and a New York close chart
  • How the different charts affect moving average
  • Is there a way of knowing whether a broker provides New York close charts?
  • Final word

Understanding the opening and closing times of the forex market

One of the advantages of forex over other instruments is its 24/5 around-the-clock nature. To retail traders, the markets are open for five full days and closed on weekends. 

The general opening time for forex is 5 p.m. EST (Eastern Standard Time), and the closing is 5 p.m. EST on Friday (slight variances exist during Daylight Savings Time). 

Brokers have access to two primary price feeds, ones that use a GMT close and the New York or 5 p.m. EST close, the latter of which is the better option. Though the majority of brokers offer the New York close charts, there is still a handful that doesn’t. 

The GMT close charting reflects six daily candles instead of five (since forex is primarily open for five full days), the sixth of which is referred to as a ‘Sunday bar’ or ‘Sunday candle.’ For the most part, these are insignificant as very little action generally occurs during this period, meaning they can provide a less clear picture than the New York close.

The difference between a GMT close and a New York close chart

With New York close charts, the Sunday bars may reflect as gaps (which don’t happen frequently). However, the key reason why New York close charting is significantly better is for convenience and providing more streamlined price action.

The difference between a GMT close and a New York close chart

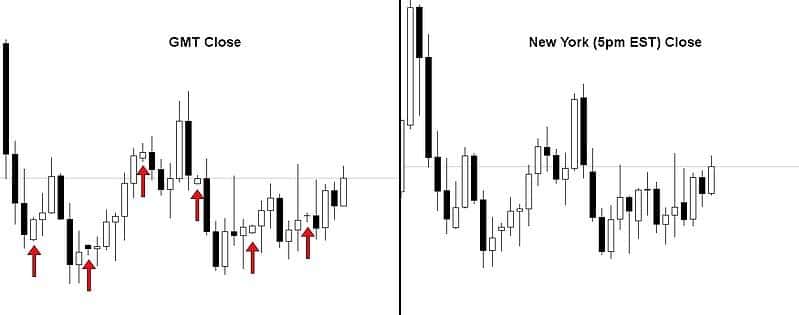
Let’s look at the image above. Despite both charts reflecting the same data, the New York close version provides ‘cleaner’ price action than its counterpart. We should bear in mind this is only a snippet. 

When observing a larger chart with added data, on the GMT close, we’ll see significantly more candles that generally don’t provide any real meaning (usually dojis and or similar strange candles reflecting thin liquidity).

These charting differences matter more for traders exclusively analyzing the daily time-frames and who also use some form of price action.

Their rationale in the first place is to view less noisy charts and see the real market sentiment. If they included the Sunday bars, they would reflect more ‘clutter.’ Furthermore, probably the most important time in the market is during the New York session because it’s the busiest time when many forex transactions occur.

We regularly see trend resumption and price breaking out of extended ranges during this period. The closing price of this session is regarded as one of the most substantial because it affirms the dominant force between buyers and sellers, and it is also a confirmation of specific price action signals or patterns.

How the different charts affect moving average

With a GMT close chart, while all the five daily candles are going to be 24 hours in length, the ‘Sunday bar’ is usually about two. When using indicators like the 20-day moving average, the settings assume that each daily candle covers 24 hours. 

With a so-called sixth one that is only a fraction of the time, the indicator will look stranger than it should be on a GMT close chart.

Is there a way of knowing whether a broker provides New York close charts?

With any trading platform, there usually is no way of knowing beforehand until one opens a demo account with a specific broker. Whether one is a new or experienced trader, this feature should be one of the first things to check. 

Also, no one can adjust the closing time of their charts since these are predetermined from the feed the broker receives externally.

Final word

Analyzing New York close charts doesn’t offer traders a considerable advantage or edge over others. GMT close charts have a higher chance of providing ‘false signals’ for those trading the daily time-frame with price action primarily since there is a lot more diluted data to analyze, even though the price is the same as with the New York close.

Traders that spend most of their time viewing time-frames lower (4-hour, 1-hour, 30 minutes, 15 minutes, 5 minutes, 1 minute) or higher than the daily (weekly, monthly) won’t be affected by this attribute. Additionally, this issue is not so prevalent nowadays because most brokers have adjusted. 

Though this article only highlights that there may be some that haven’t, something that traders have to consider. Nonetheless, for swing traders that exclusively trade the daily time-frame, the aim is to have a more precise chart reflecting more closely the real opening and closing markets of forex without any unnecessary candles that may cloud analysis.

ShareTweet
Previous Post

Major US Indices Struggling to Bounce Back as Oil Prices Edge Higher and Gold Plummets

Next Post

Dollar Weakens on Rate Hikes Doubts as Focus Shifts to BOE and BOJ

Related Posts

Multi-time frame Analysis in Forex Trading

Multi-time frame Analysis in Forex Trading

by Tim Baudin
February 23, 2021
0

Multiple time frame analysis (MFA) is a type of technical and price action analysis that involves looking at a currency...

ADX+RSI: The Unbeatable Forex Trading Strategy

ADX+RSI: The Unbeatable Forex Trading Strategy

by Chintan Patel
January 18, 2021
0

In order to pile up profits in the Forex market, you should choose a strategy that is backed by statistics....

An Introduction To Forex Trend Indicators

An Introduction To Forex Trend Indicators

by Adam Stanley
January 13, 2021
0

The trend is your friend’ is an old and popular expression in the financial markets. Consistently identifying the trend is...

Using Band Trading Strategy for Profits

Using Band Trading Strategy for Profits

by Adam Stanley
November 5, 2020
0

What is band trading? Do markets trend about 15 % of the time only?  So, what to do during the...

4 Forex Strategies Based on Trading Style

4 Forex Strategies Based on Trading Style

by Richard Brase
October 7, 2020
0

The foreign exchange market is the largest financial market in the world, where many have amassed fortunes just by playing...

Load More

Leave a Reply Cancel reply

Your email address will not be published. Required fields are marked *

Best Forex EA

  • ROFX 9/10
  • Forex Fury 8/10
  • FXgoodway 7.5/10
  • Z Trader FX EA 7/10
  • Forex Incontrol Reborn 6.5/10

Popular News

  • The Best RSI and CCI Combination Trading Strategy for Optimum Returns

    The Best RSI and CCI Combination Trading Strategy for Optimum Returns

    2 shares
    Share 2 Tweet 0
  • Rofx Review – High Profitability and Stable Performance Analysis

    29 shares
    Share 29 Tweet 0
  • The Best Forex Scalping Strategy – Using 3 Popular Technical Indicators

    0 shares
    Share 0 Tweet 0
  • The Best MT4 Indicators & Expert Advisors For Forex Trading

    2 shares
    Share 2 Tweet 0
  • How to check if the indicator is repainting?

    2 shares
    Share 2 Tweet 0

Trading

Footer

We are dedicated to demystify the world of forex trading for you – no matter what level you are on.

Categories
  • Automated Trading
  • Day Trading
  • Forex Basics
  • Forex Brokers
  • Forex Education
  • Forex Forecasts
  • Forex Indicators
  • Forex Market Commentary
  • Forex Robots
  • Forex Signals
  • Forex Tools
  • Forex Trading Strategies
  • Fundamental Analysis
  • Money Management
  • News
  • Risk Management
  • Social Trading
  • Technical Analysis
  • Top World Traders
  • Trading Psychology
  • Uncategorized
Tags
arbitrage atr bollinger bands cci chart patterns classics copy trading courses day trading forex brokers forex charts forex ea forex education forex forecasting Forex Indicators forex software reviews grid trading hedging ichimoku macd market cycles news trading oscillators price action trading rsi social trading strategies tips & tricks trading bots trading platforms trend trading Video
  • Terms of Use
  • Privacy Policy
  • Compensation Disclosure
  • Risk Disclosure
  • About Us
  • Contact Us

Copyright © 2021 by ForexEzy.com

No Result
View All Result
  • Home
  • Forex Education
    • Forex Basics
    • Forex Trading Strategies
    • Money Management
    • Risk Management
    • Technical Analysis
    • Fundamental Analysis
    • Trading Psychology
    • Social Trading
    • Automated Trading
  • Forex Tools
    • Forex Robots
    • Forex Indicators
    • Forex Signals
  • Top Forex Brokers
  • Top Forex Robots
  • Commentary
  • Blog

© 2021, Forexezy.