
Like the concept of trend, support and resistance are one of the major concepts in trading. Support and resistance are psychological price levels where forces of supply and demand meet.
At support line demand starts to increase and supply starts to decrease. This is a buying pressure. Inversely at resistance line, supply starts to increase and demand starts to decrease. This situation is a selling pressure.
Support and resistance lines are horizontal straight lines. There is no exact or accurate method to draw support and resistance lines. Thus, a trader’s drawn support and resistance lines might not match with other traders completely.
Thus, support and resistance lines are drawn by taking best possible high and low points, in this case, some traders might consider the lowest and highest points of candlesticks where some others might consider the open and close price of candlesticks in low and high points of a trend.
The support line is a psychological price level where the price gets strength and become bullish when the price comes near or at this line. Inversely, when the price gets near resistance line, it gets weakness. As a result, price movements become bearish.
Support and resistance can be used in 3 ways.
- Reversals
- Breakouts
- Pullbacks
Reversals:
Support should be considered as a base level of price from which price tends to bounce from this line and becomes bullish or buyer dominant (Bullish reversal). Resistance should be considered as a binder near which price gets a resistance force in its upward move and this bullishness of the price becomes weak.
As a result, as the price comes near resistance line it starts falling as price tends to become bearish near or at this resistance line (Bearish reversal).
Here are some examples
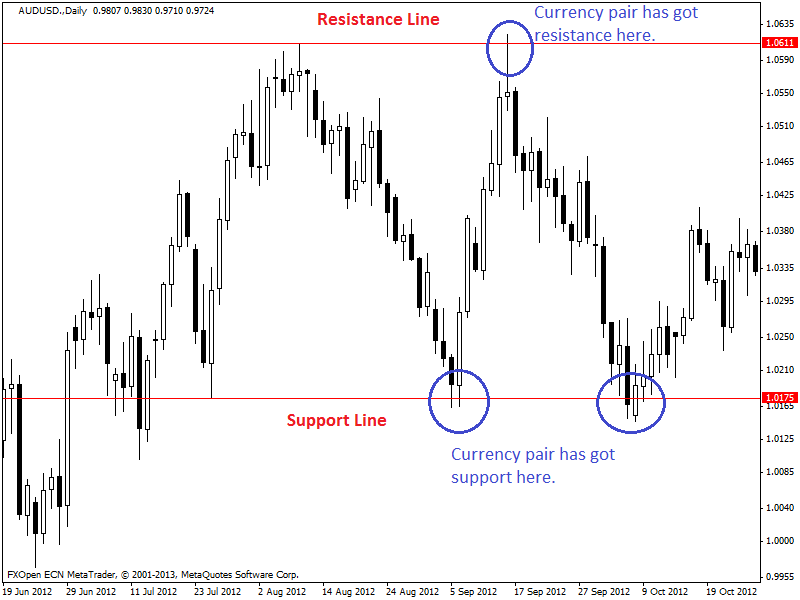
In the chart above, we can see the support and resistance line have drawn in the chart of AUD/USD currency pair. The support line is a combination of last two low points. Inversely, resistance line is a combination of two high points. First, we have to draw these lines. Trading opportunities occur as the price comes near these lines.
As price gets near support line, we should look for a long position as most of the cases price tends to become bullish at or near this support line. In the chart given above, we can see that AUD/USD has got support twice (blue colored circles near support line) from this support line and started a significant upward movement.
Inversely, when price or candlestick went near or at resistance line, it has got weakness or bearishness as that resistance line worked as a binder or resistance and hence price started falling. So we should look for long position opportunity as the price is near or at support line and look for short position opportunity when the price is near or at resistance line.
When price moves in between support and resistance line repeatedly then it is trading zone or flat zone where there is no significant trend.
This trading zone becomes more profitable for trading by using support and resistance lines when the trading zone or range is wide or broad. Breakout possibility is high when this trading range or zone is narrow. Here is an example.
Breakouts:
It is not necessary for the price that it will always turn into a bullish trend when comes near or at support line and will turn into a bearish trend when the price comes near or at resistance line. Sometimes price may break these support and resistance lines.
We call it breakout when price breaks out the resistance line and keep its bullish movement intact and breakdown when price breaks the support line and keep moving in its previous bearish trend. Thus, price ignores the reversals near or at support or resistance lines.
These breakouts can be traded effectively and profitably. Breakouts are the strong signal of a major trend. When price or candlestick lies between support and resistance lines, then there is no trend lies there, or it is a trading zone or ranging zone.
As soon as price breaks out the resistance line, the currency pair moves into the uptrend or bullish trend and then price tends to remain in this uptrend for a prolonged time.
If price breaks down the support line then currency pair has moved into a downtrend or bearish trend and then price tends to remain in a downtrend for a prolonged period.
Here is an example of bullish breakout or resistance line breakout.
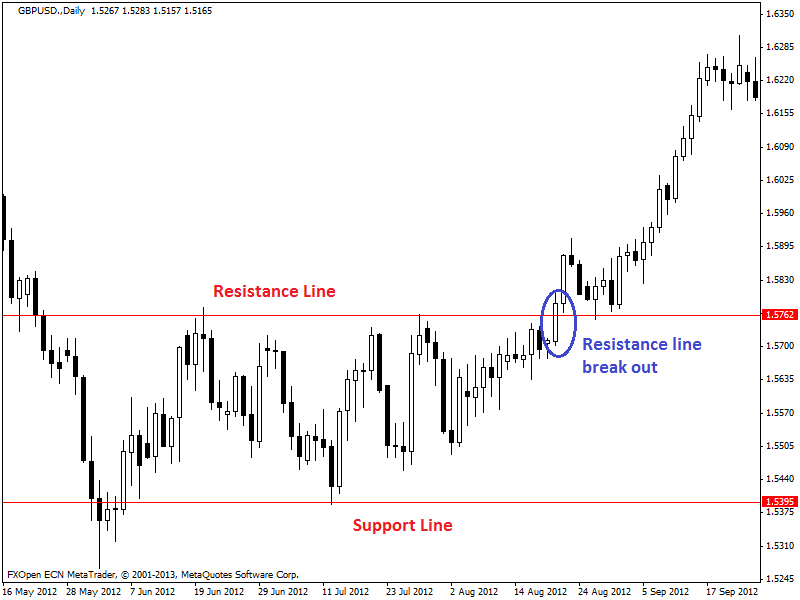
In the chart given above, we can see a successful breakout in the daily chart of GBP/USD. Here, we can see the support and resistance lines and then a breakout of resistance line (blue colored circle). Remember that it is necessary for a candle or price to break out the resistance line with a strong bullish candle, otherwise, the breakout may not be successful and can be turned as fake-out (when a breakout fails and come back into the trading range within a short time).
So it is mandatory for the price to or candlestick to show good strength when resistance breakout happens otherwise there is a high possibility of fake-out. We should take this resistance breakout as an entry signal for taking a long position.
Now, let’s take a look at support line breakdown. Here is an example,
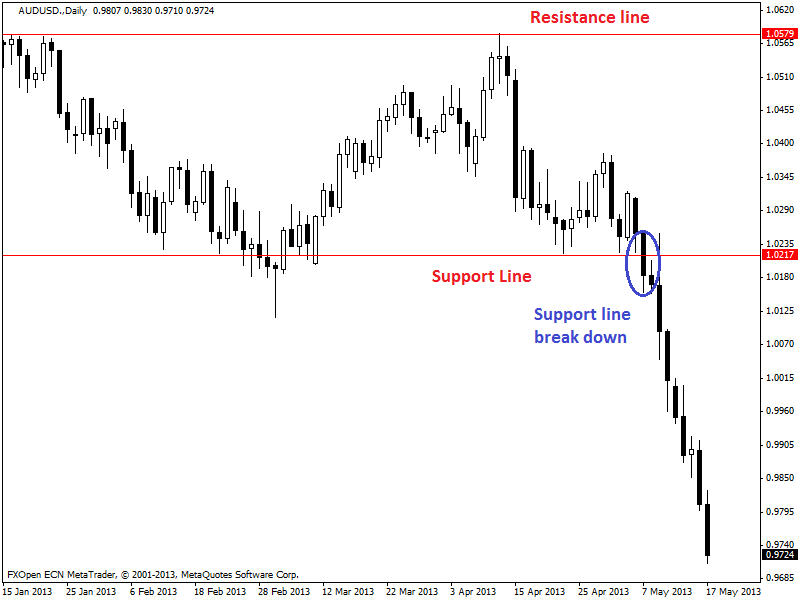
In the chart given above, we can see the support and resistance line and a breakdown of the support line (blue colored circle) in the daily chart of AUD/USD. This is an example of successful breakdown as the support line has broken down with a heavy bearish candle and thus the downtrend continued vigorously.
In the case of breakdown or support line breakout, there should be a strong or heavy bearish candle; otherwise, there is a chance of fake-out. We should take this support line breakdown as an entry signal for taking a short position.
Pullbacks:
After a successful resistance breakout, the broken resistance line becomes support line and the price has a tendency to retrace to this new support line (broken resistance). Thus, price tends to pullback or bounce back into the bullish trend again.
Inversely, when support line breaks successfully, this broken support line becomes new resistance and price intends to retrace to this new resistance and then bounce back into bearish trend.
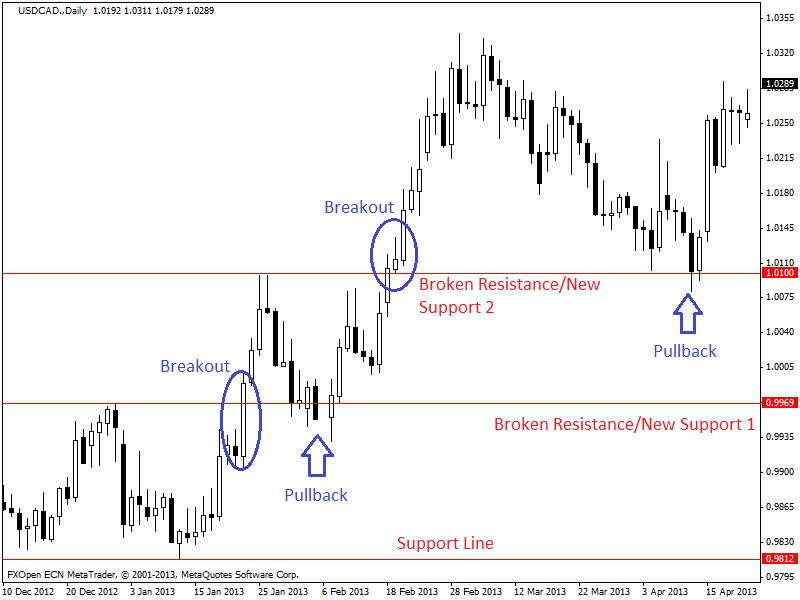
In the chart above, we can see support and resistance lines including broken resistance/new support lines in the daily chart of USD/CAD. Every breakout has changed the previous resistance as a new support. Here, we can see 2 successive breakouts thus 2 resistances has become new support.
Another important thing is; after a breakout price has retraced back near or at the new support line. Then bounced back to its previous trend as it has got support/strength from the support line. There are two pullbacks shown in this chart.
Now let’s take a look at the example of a bearish pullback after a successful breakdown.
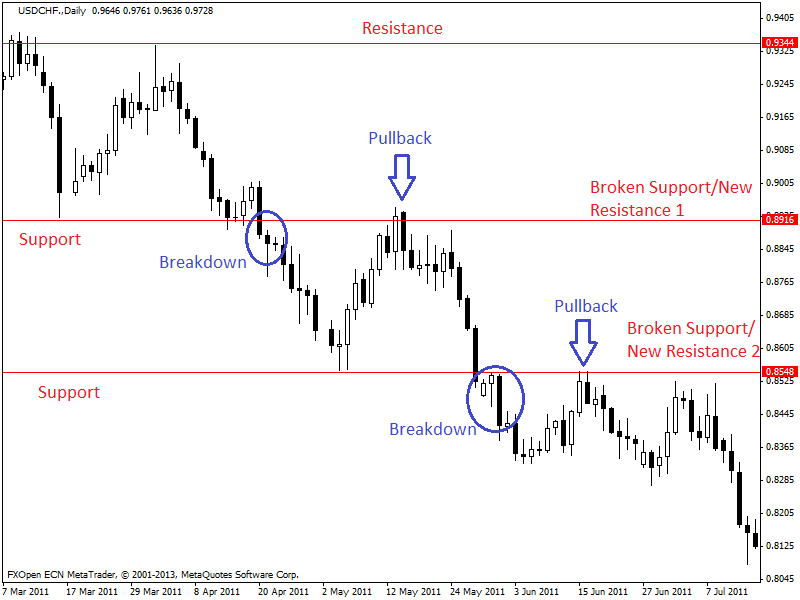
In the chart above, we can see support and resistance lines including broken support/new resistance lines in the daily chart of USD/CHF. Every breakdown has changed the previous support line as a new resistance. Here, we can see 2 successive breakdowns thus 2 support lines have become new resistance.
Another important thing is after a breakout price has retraced back near or at the new resistance line and then bounced back to its previous trend (Downtrend) as it has got resistance/binder from the resistance line. There are two pullbacks shown in this chart. Note:
Each three methods of using support and resistance line are effective and profitable. A trader should use it according to his own choice and should consider that the method he/she is using is suitable with his personality or not. For an example, you have to deal with price hike/high volatile condition and as per pullback method during breakouts. Most of the times price tend to retrace after a breakout or breakdown.
So breakout trading requires patience, and flexible stop loss/wide stop loss range otherwise it might not be profitable enough. Reversals are effective for short-term trading. Breakouts and pullbacks will work well in trending condition rather than range condition.


