
What is a hockey stick chart?
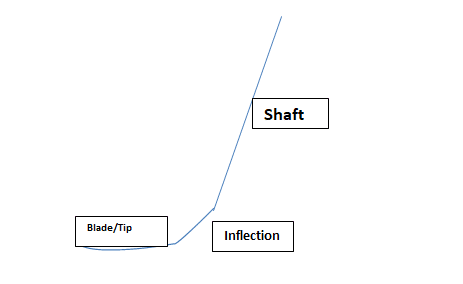
A hockey stick chart, as you may infer from the name, is a trend line whose formation closely resembles a hockey stick. Hockey stick charts are formed when there is a drastic shift in the market trend, specifically when a sideways trend or relative inactivity is followed by a steady spike.
The key features of such a trend include a tip/blade representing the period of inactivity, an inflection representing the gathering of momentum, and a long shaft representing a steady rise in the price of an asset, the volume of sales, etc. The hockey stick pattern interests traders because it has a direct impact on the price of the stock being traded.
Interpreting the hockey stick pattern
Some of the key aspects of a company that a hockey stick chart can be drawn around include sales volumes, revenue levels, new branches, number of employees, etc. A sharp rise in sales figures indicates that a company is likely to increase its profit. Therefore, when analyzing sales volume, traders will respond to a hockey stick chart with higher purchases for the company’s stock.
However, it is equally important to prove the underlying reasons for the formation of a hockey stick chart. This creates a more accurate picture of the market than acting instinctively without a solid foundation. A spike in sales volume after a pandemic isn’t as exciting as a spike in sales during a pandemic.
The hockey stick pattern is also a sign of the possibility of underlying problems within a company. For example, inefficiencies in logistics may have been responsible for low sales during the period under review. Inadequate marketing such as low levels of advertisement may also be responsible for low sales volume. Therefore, your usage of hockey stick charts to make trade calls should be based on an evaluation of underlying market fundamentals.
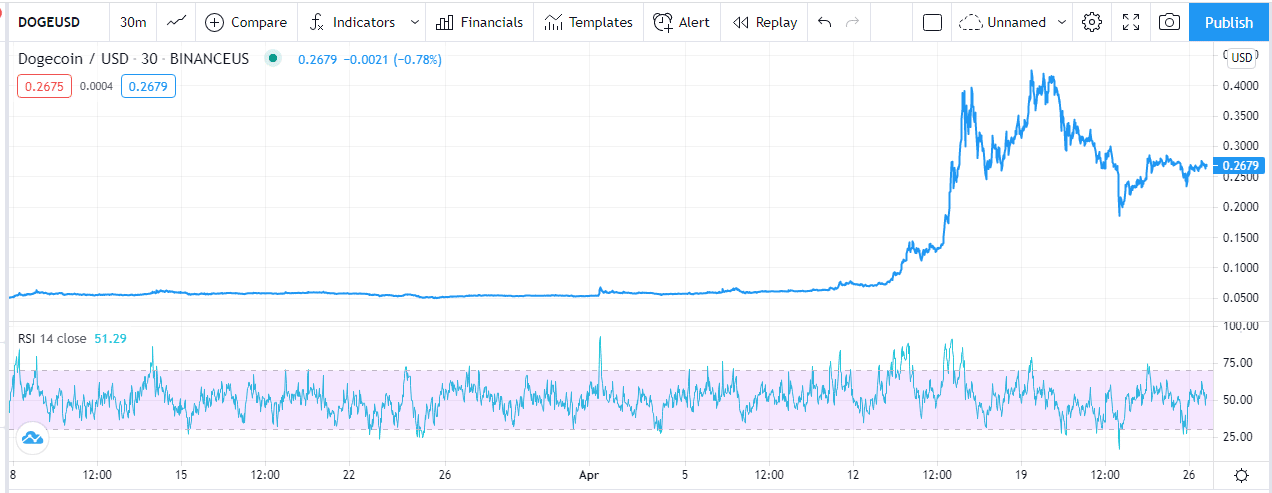
For businesses, the lag phase (blade) may represent the few weeks or years following the inception of the business or a period of stagnation due to a lack of advertisement, lack of product diversification, etc. The inflection will show up following actions like increased advertisement and introduction of new and highly competitive products. Factors such as new acquisitions will be responsible for the growth spurt in the hockey stick (shaft). However, in some instances, celebrity endorsements may spur popularity-driven demand, as seen in Dogecoin’s endorsement by Elon Musk, Snoop Dogg and other popular figures. The chart below shows the effect of endorsement and popularity-driven rise of Dogecoin earlier this year.
How can a hockey stick chart affect a company’s performance?
1. It can inform about the need to re-strategize product delivery system
By evaluating the hockey stick chart, a company may scrutinize its inactive and active sales periods, to address the underlying weaknesses. For example, an audit may reveal that most of the orders that came in towards the end of a sales period, were not delivered because of the overstretched delivery system within the company. This may prompt a company to increase its delivery fleet or hire more delivery persons.
The realization that certain regions had longer delivery timelines may prompt the management to establish new production branches or dispatch depots in the affected regions, to minimize the time taken to deliver products.
2. It can necessitate evaluation of return policy
The hockey stick pattern can help a company to assess its product return policy. For example, if an audit of the return policy reveals that the company has an unattractive return policy, a more appropriate policy can be worked out. This will increase demand and raise the close ratios across the trading calendar.
3. It can enhance adoption of proper sales analytics
Sales projections and analytics are among the most useful tools for companies, and these are often reflected in the formation of hockey stick patterns. Sales figures can never be met if they are based on the wrong analysis of market trends. Also, a wrong analysis may result in the adoption of sales strategies that may result in underperformance of the sales team.
Similarly, some strategies may result in sales figures above the set targets. Therefore, it is prudent to get the right sales analytics figures to help the company perform within its actual potential.
Options for gaining from the hockey stick pattern
The common idea among many traders is to follow the trend. This usually means buying the company’s stock. However, the alternative way to get the most out of the hockey stick formation is by going for CFDs (Contracts For Difference).
With CFDs, you will still benefit from the price movements, but without actually owning the stock. CFDs will also come with the advantage of leveraging your position even if you don’t commit the whole amount immediately. This is not possible with stock. The third way to benefit from the hockey stick is by buying shares directly, which will enable you to earn dividends when profits come in as a result of increased sales.
How to get out of recurrence of hockey stick patterns
While hockey stick patterns are good news for many traders, they are never good for companies if they keep recurring within short periods. Repeat occurrences may signal underlying inefficiencies in a company and may result in the volatility of its stock. Below are some of the mechanisms that can be employed by a company to eliminate this phenomenon:
- Consider allocating more resources to marketing to ensure that your target market is well-informed about your product, including pricing and delivery options available.
- Expand your fleet and enhance the delivery system to ensure efficiency in meeting delivery timelines and reduced backlog of deliveries regardless of whether or not it is high season
- Use well-informed market analytics to set realistic sales targets. Also, motivate the sales team through incentives to increase the chances of hitting the set sales targets.
Bottom line
The hockey stick chart is a strong indicator of a spike in the performance of a company’s assets. Traders can take advantage of the formation to buy stock, CFDs, or shares of a company. However, it is important to query the underlying reasons for the formation of the pattern before making a decision. For companies, the formation of hockey stick patterns should not be recurrent within short periods. Companies should therefore establish ways of eliminating frequent hockey stick charts. This will help stop company assets from volatility.


