What is a Moving Average?
Moving Averages (MAs) are employed by traders to help them identify new and established patterns in the markets. In finance, it is a computational method that is used to determine averages by analyzing data to identify trends and smooth out price movement by filtering out “noise” caused by random oscillations.
When it comes to trading, MAs are particularly popular due to their ease of use and the variety of applications they may be used for. Simple Moving Averages (SMA) are flexible and can be tweaked depending on the trader’s style and the time range in which they wish to trade, among other factors.
Many traders utilize the shorter, faster MAs as entry triggers, while the longer MAs are used to filter out unnecessary market “noise.”
When it comes to identifying trending, ranging, and correcting environments with Moving Averages, they are simple to apply and may be very useful.
Traders frequently employ more than one MA since the combination of two Moving Averages is more effective in detecting trend changes. To put it another way, when the short-period MA crosses over the long-period, slower MA, it is a signal to go long. It is possible that the long trading bias will persist until the MAs change their trajectory or until the target is reached.
Types of moving averages
1. Simple Moving Average (SMA)
When computing the SMA, we only integrate an asset’s closing price. In order to compute the MA, the sum of the closing prices is divided by the number of periods.
2. Exponential Moving Average
The EMA is computed by allocating more weight and consequently ascribing greater significance to the most recent trading data. Therefore, the EMA indicator tends to react to the latest price fluctuations substantially.
EMAs of 12 and 26 days are the most commonly employed for short-term averages, while the 50 and 200-day EMAs are preferred for longer time periods.
Moving Average strategies
One of the toughest choices to make when developing MA for your analysis will be to determine how long the circumstance is likely to remain viable.
It doesn’t matter if you use an EMA or SMA. Generally, shorter intervals produce more signals, but most of those signals are false, while longer Moving Average periods produce fewer signals, most of them are genuine.
Nevertheless, signals tend to take a longer time to show on long-period MAs than short period MAs. This is an existential limitation on the efficiency of MAs.
In order to keep track of the strength and reliability of a trend, consider utilizing a long-period SMA. Based on the duration of the current trend and after assessing the current state of the economy, use either a 30-day or a 50-day SMA.
When a trend has been in place for a significant amount of time, the 50-day SMA should be used as an exit indicator. However, as an additional measure to cover your risk exposure, use a stricter exit procedure if the economy is experiencing a boom.
The most popular SMAs
10-day SMA stands out as being a favorite of many short-term traders, and it is also excellent for swing and day traders alike.
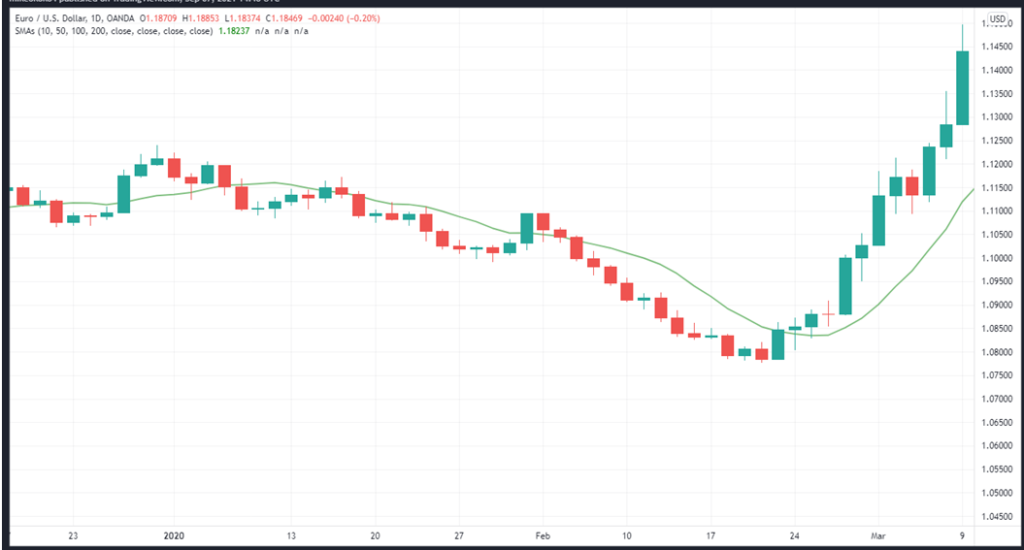
20 SMA should ideally be a short-term trader’s last stop. You go beyond it, and you get to primary trends.
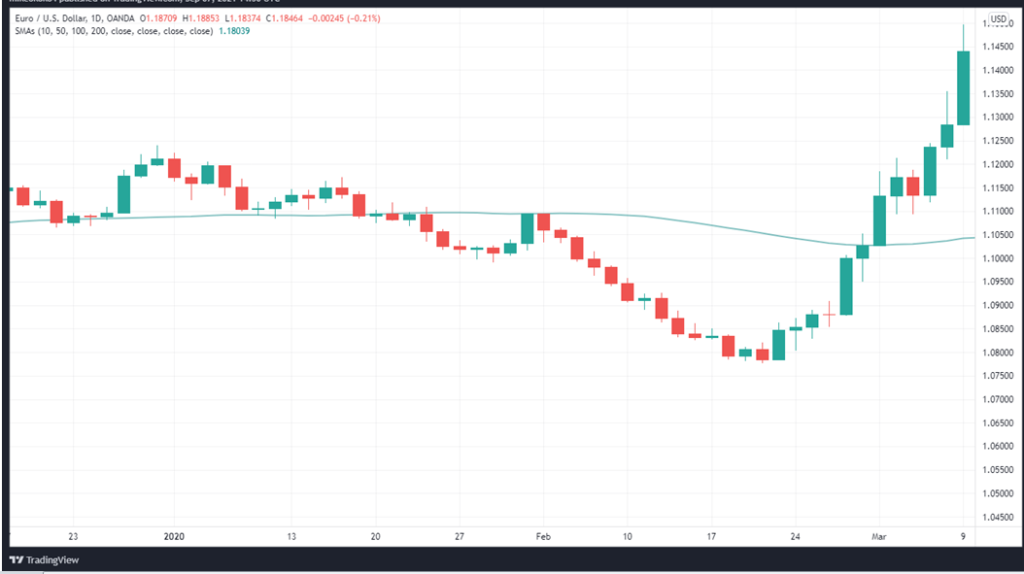
The 200-day SMA is the long-term trader’s watchtower. When looking for a bullish or bearish trend in a stock, investors generally wait for crossings above or below the 200 MA.
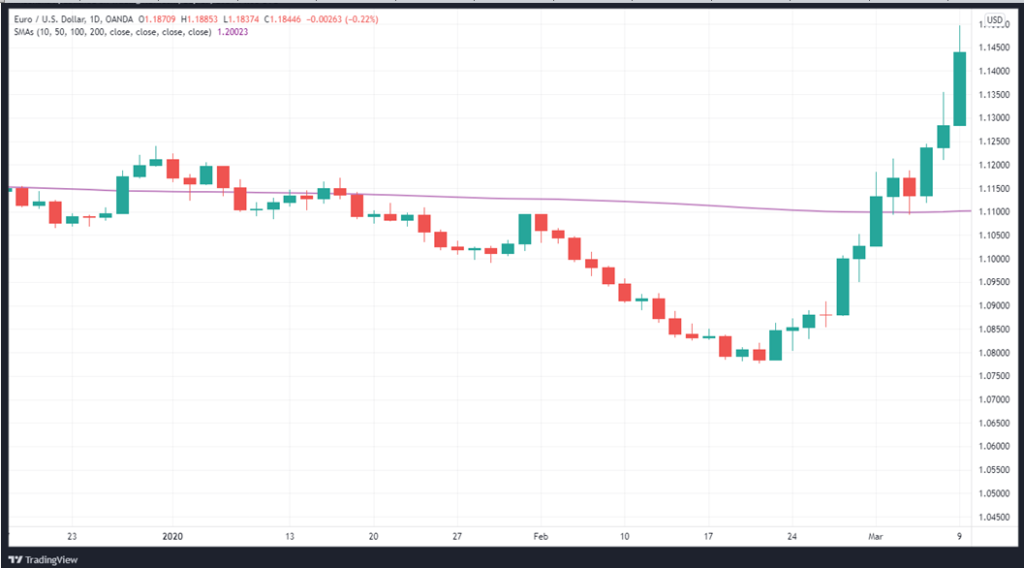
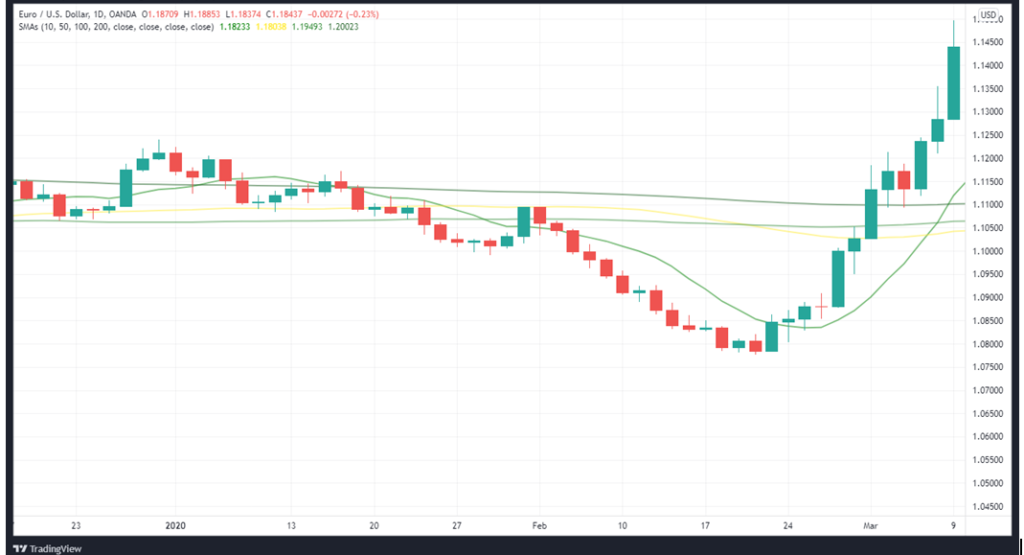
Let’s put all five of them on one chart just to see how they differ. They are certainly aligned in a manner that reflects a diverse range of timeframes and trading strategies in this manner.
When to sell using SMA
SMAs have historically been employed to predict the exact sell and purchase positions on a chart by a large number of traders. A trader may be able to succeed, utilizing numerous averages, but using just a single SMA indicator will not suffice.
If you get to that stage, spare yourself the effort and trouble and just utilize the averages to evaluate how strong that move is. This is more effective than focusing on buying and selling at the appropriate points in time.
SMA crossovers
Simply using Moving Averages to trade the markets can provide you with a solid path for success.
In order to properly evaluate this, you must first recognize the MA tends to drag before sending signals. It is evident that there is a delay when you factor in the fact that you have to wait for one lagging signal to pass over another.
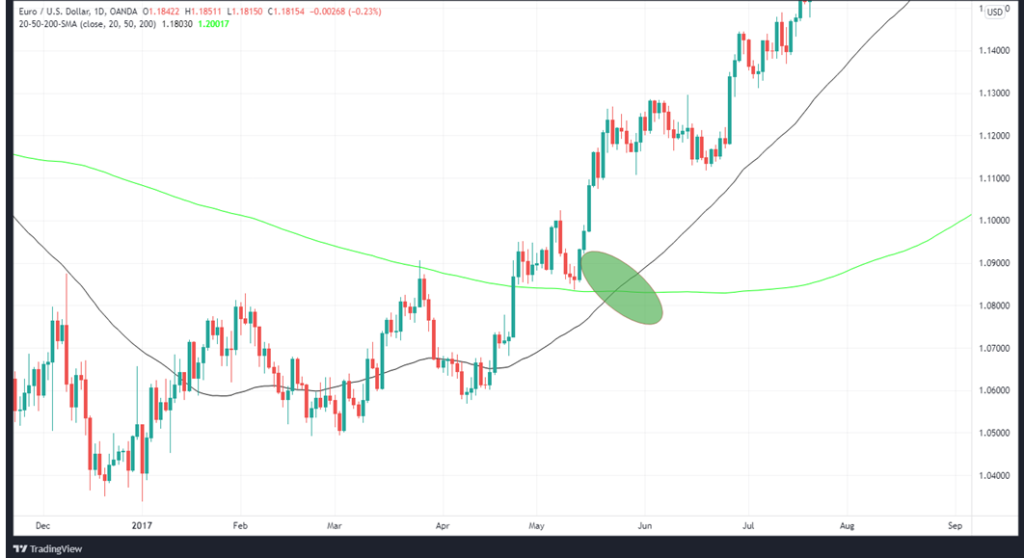
The 50 and 200 SMAs are popularly integrated with the aim of spotting crossovers. In technical analysis, a golden cross occurs when the 50 SMA crosses over the 200 SMA.
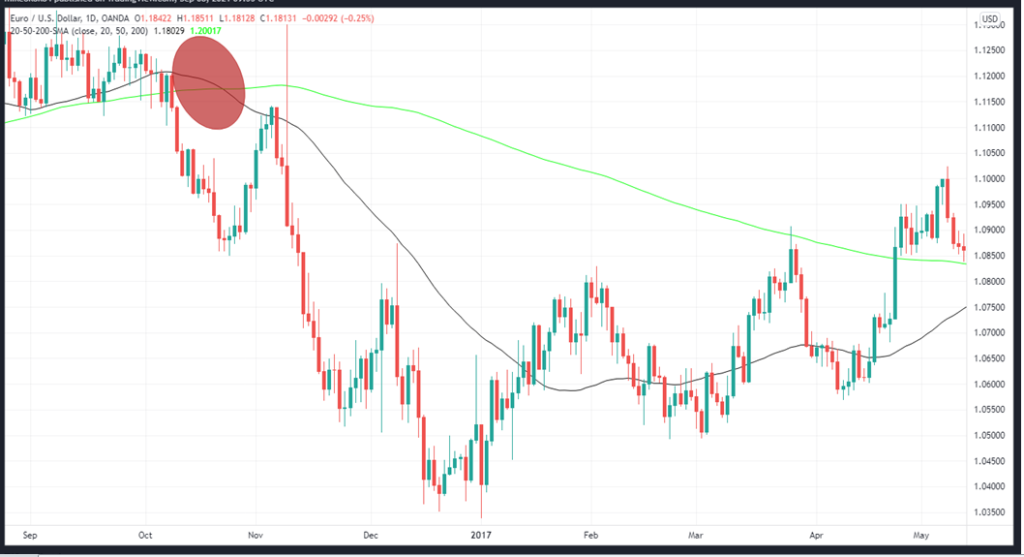
In contrast, when the 50-SMA crosses the 200-SMA in a downward direction, it forms a death cross.
Both of these ideas apply in particular to long-term investment. They can be changed for day trading, however.
In summary
The use of MAs can be crucial for technical analysis methodologies, and a mix of strategies can result in both long- and short-term projections when applied together. Support and resistance levels can also be located using Moving Averages.


